
Fig. 5.
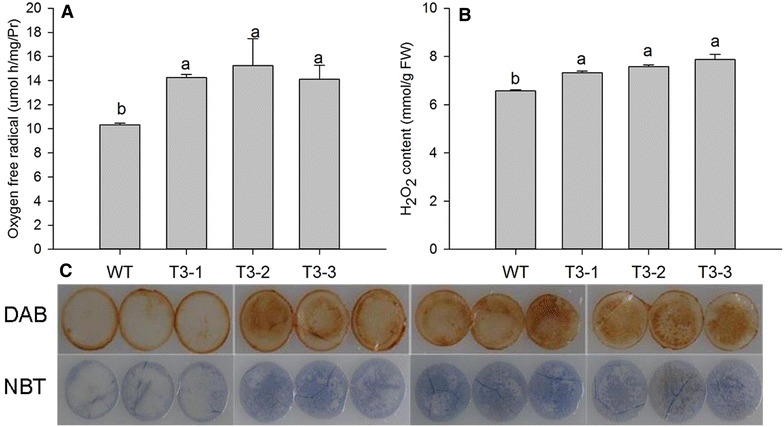
H2O2 levels and production rate of O·−2 in WT and transgenic plants. Data are expressed as the mean ± SE (n = 5, five biological replicates per lines). Different letters indicate statistically significant differences at P ≤ 0.05. a represents the content of H2O2. b indicates production rate of oxygen free radical. c shows histochemical staining of H2O2 and O·−2