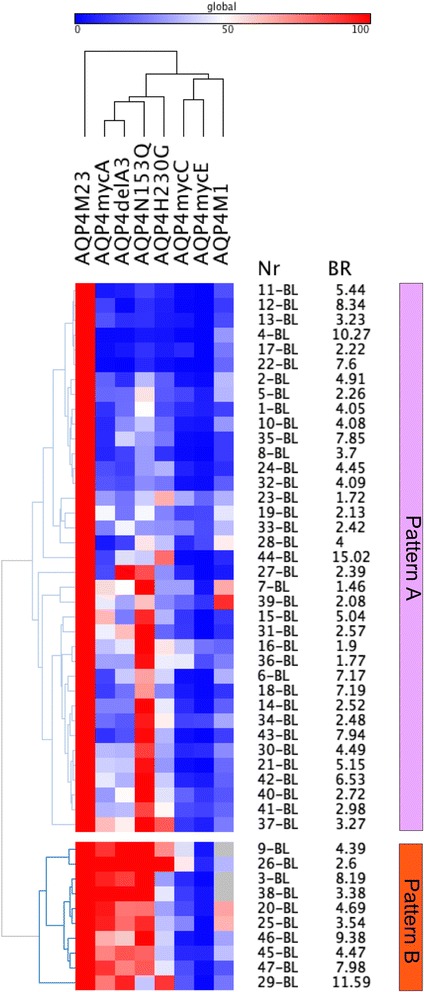
Fig. 3.

Heatmap of serum AQP4-antibody levels against AQP4-M23, AQP4-M1 and AQP4-M23 mutants (columns) at baseline. Rows are individual samples with patient IDs (Nr) and flow cytometry AQP4-M23 binding ratios (BR) shown at the right side. Data are shown as percent binding of AQP4-M23. Values range from blue (0 %) to white (50 %) to red (100 %). Columns were clustered according to their Pearson’s correlation coefficients, and rows were clustered according to their Eucledian distance (both average linkage). Two major antibody binding patterns were identified, a loop A-dependent pattern A (upper panel) and an independent pattern B. The heatmap was generated using GENE-E matrix visualization and analysis software (http://www.broadinstitute.org/cancer/software/GENE-E/index.html)
