
Fig. 3.
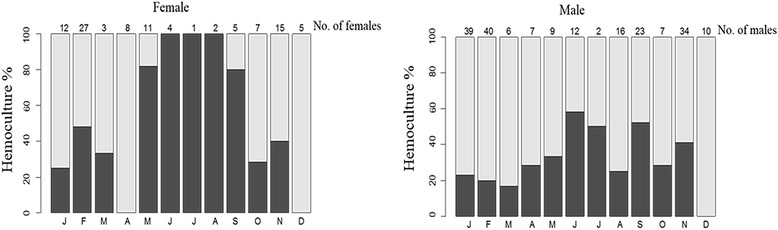
Proportion of female and male coatis with transmission potential (positive hemoculture) per month (accumulated from 2005 to 2012). The number of sampled coatis is indicated above the bars
Official websites use .gov
A
.gov website belongs to an official
government organization in the United States.
Secure .gov websites use HTTPS
A lock (
) or https:// means you've safely
connected to the .gov website. Share sensitive
information only on official, secure websites.
Proportion of female and male coatis with transmission potential (positive hemoculture) per month (accumulated from 2005 to 2012). The number of sampled coatis is indicated above the bars