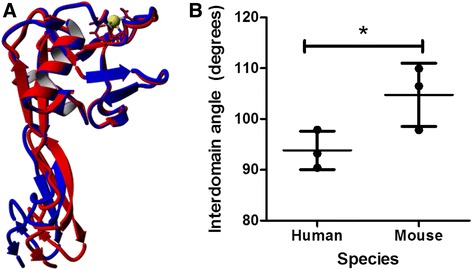
Fig. 2.

Mouse E-selectin showed a greater interdomain angle than human. a Mouse E-selectin is shown in blue and human E-selectin is shown in red. b The angle is measured from geometric center of residues 1–118 to the geometric center of residues 119–157 with a hinge at the pivot. Mean and standard deviation are plotted. Calcium ion is shown in yellow. *P value < 0.05 (two-tailed t-test)
