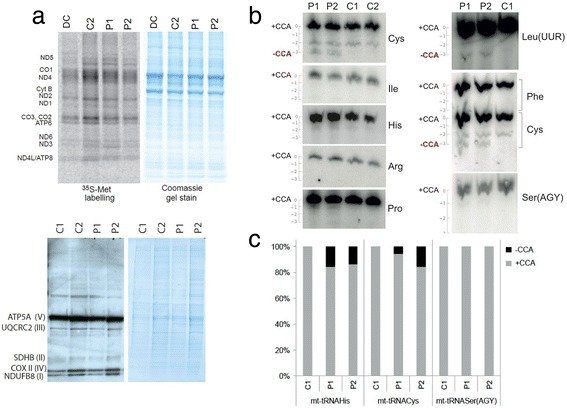
Fig. 3.

a Upper: Mitochondrial translation assay in disease control (DC) and patient (P1 and P2) fibroblasts. Coomassie blue (below) used as a loading control. The mitochondrial translation products are indicated on the left: four subunits of complex I (ND), one subunit of complex III (cyt b), three subunits of complex IV (CO) and two subunits of complex V (ATP). Lower: western blot for OXPHOS proteins in patients P1 and P2 compared to controls. The OXPHOS subunits detected are shown to the left with their respective complexes in parentheses. b High-resolution Northern blot analysis of total RNA isolated from the TRNT1 deficient patient or control primary fibroblasts. The blots were probed with the mt-tRNA-specific RNA probes as indicated. Full-length mt-tRNAs are indicated as + CCA (“0” on the scale). Mt-tRNAs lacking CCA are highlighted by “-CCA” (“-3” on the scale next to each blot). c The results of cRT-PCR analysis for mt-tRNAHis, mt-tRNASer and mt-tRNACys in control and TRNT1 deficient patients. The following number of clones were analysed for each sample: C1: 29, P2: 27, P1: 25
