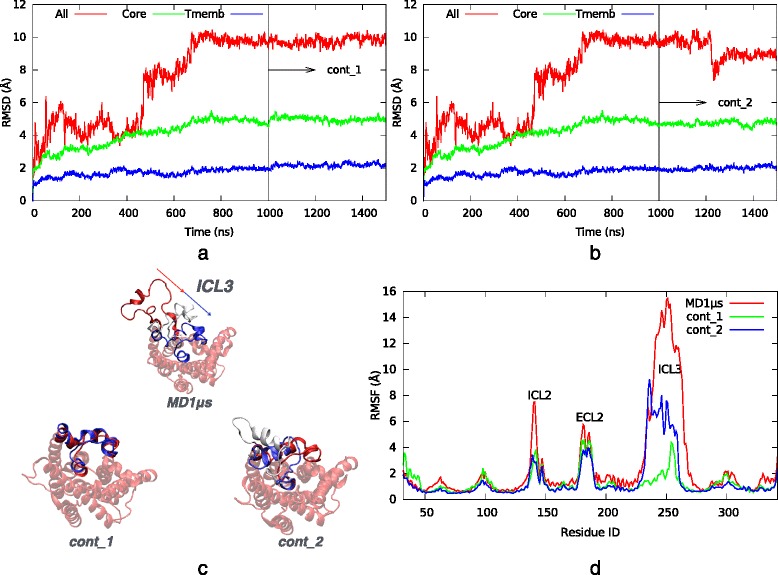
Fig. 2.

Results of original and continuation runs without restraints. RMSD profiles of (a) the first MD1μs_cont1 and (b) the second MD1μs_cont2 continuation runs (500 ns each) shown together with the original 1 μs MD run. c Intracellular view of the initial (red), intermediate (white) and final (blue) snapshots superimposed for each run. d RMSF profiles for the original, MD1μs_cont1 and MD1μs_ctd2 runs
