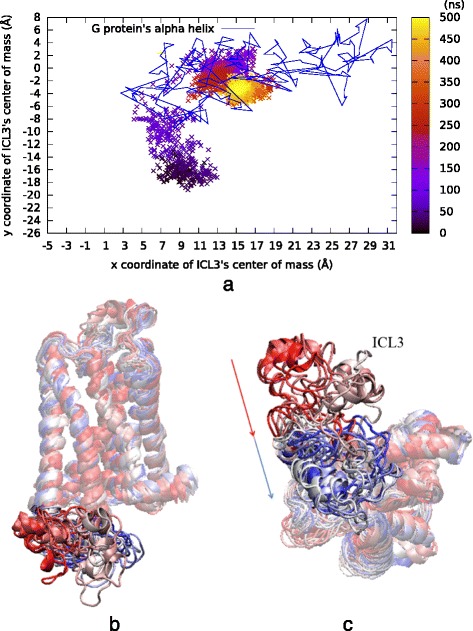
Fig. 7.

Results of 500 ns long rstr4 run. The expected ICL3 closure was observed under 100 ns, when an additional bond restraint was imposed between the backbone atoms in the ligand-binding site. a ICL3’s center of mass (x and y only) color-coded by time step. Lines represent the G protein’s a helix x and y coordinates extracted from the active state’s crystal structure (PDB id: 3SN6). b Side and (c) intracellular views of 20 snapshots colored from red (initial), to white (intermediate), to blue (final) during simulation
