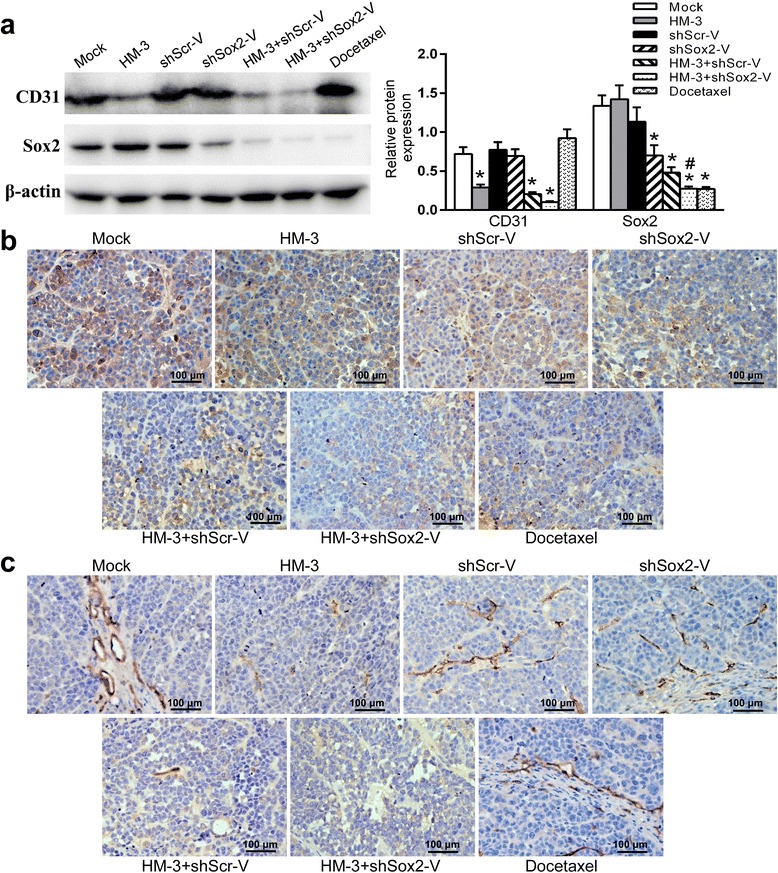
Fig. 4.

Expression of Sox2 and CD31 in the tumors of each treatment group. a The expression of Sox2 and CD31 were examined with WB assays. The quantification assay of WB results was also presented. Data shown was mean ± SD obtained from three independent experiments. * P < 0.05 vs Mock group, #P < 0.01 vs HM-3 + shScr-V group. b The representative images of IHC staining for Sox2 of tumors treated in each group. c The representative images of IHC staining for CD31 of tumors treated in each group
