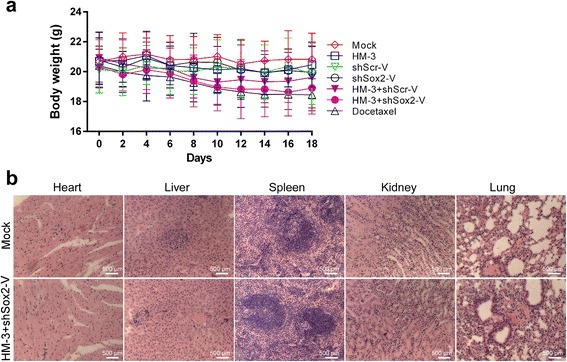
Fig. 7.

Systematic toxicity in the mice of each treatment group. a The mean body weight of tumor-bearing mice treated in each group was measured during the study. The data shown was mean ± SD obtained from each group. b The images of H&E staining of major organs of mice treated with NS and HM-3 + shSox2-V
