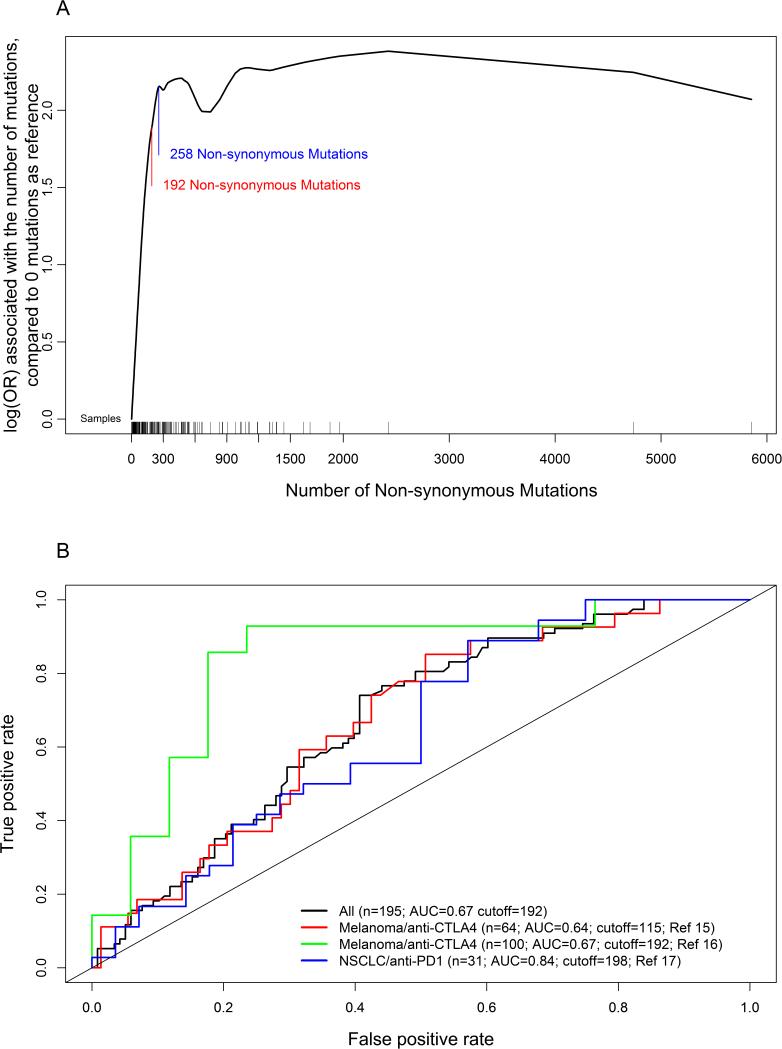
Figure 1.
(A) Generalized additive model for the relationship between the number of non-synonymous mutations and response to checkpoint inhibitor using previously published data in melanoma and NSCLC. Y-axis is log(odds ratio) associated with the number of mutations, compared to zero NsM as reference. Blue line: 192 non-synonymous mutations, which is the cutoff based on ROC analysis. Red line: 258 non-synonymous mutations. OR: odds ratio. (B) ROC analysis for the number of non-synonymous mutations using previously published data in melanoma and NSCLC. Black line is the analysis for all combined data; red line is the analysis only for one melanoma study; blue line is the analysis for the other melanoma study; and the green line is the analysis for lung cancer data.

