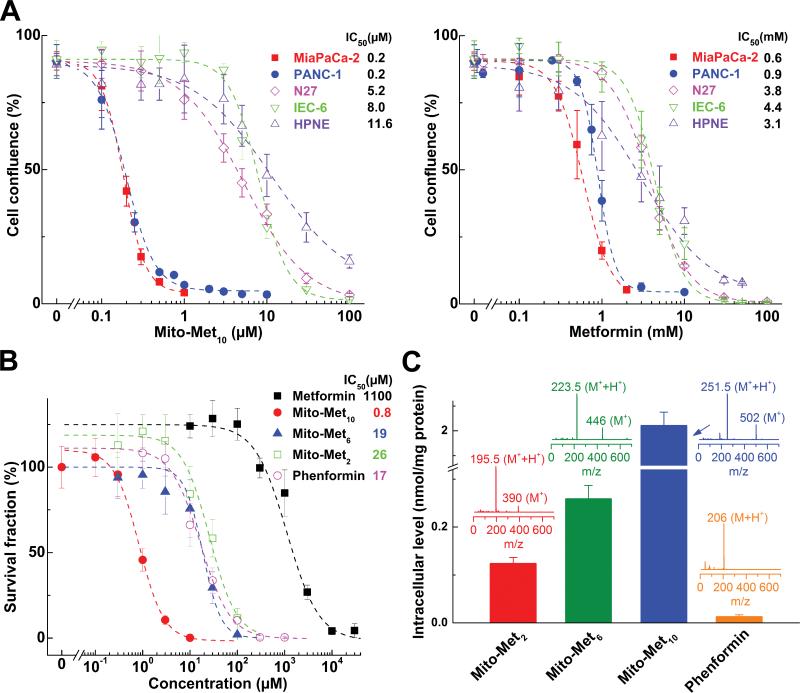
Figure 3. Effects of Met and Mito-Met analogs on pancreatic cancer and normal cell proliferation.
(A) Effects of Mito-Met10 (left) and Met (right) on cell proliferation (same conditions as in Fig. 1B). Cells were treated with Mito-Met10 or Met and cell growth monitored continuously. The cell confluence (as control groups reach 90% confluency) is plotted against concentration. Dashed lines represent the fitting curves used to determine the IC50 values. (B) MiaPaCa-2 cells were treated with metformin analogs for 24 h. The calculated survival fraction is plotted against concentration of the compounds. Dashed lines represent the fitting curves used for determination of the IC50 values. (C) Cellular uptake of phenformin and Mito-Met analogs was quantified using LC-MS/MS. Inserts show the mass spectra of the compounds. All Mito-Met analogs show up as monocations (M+) and dications (M++H+).

