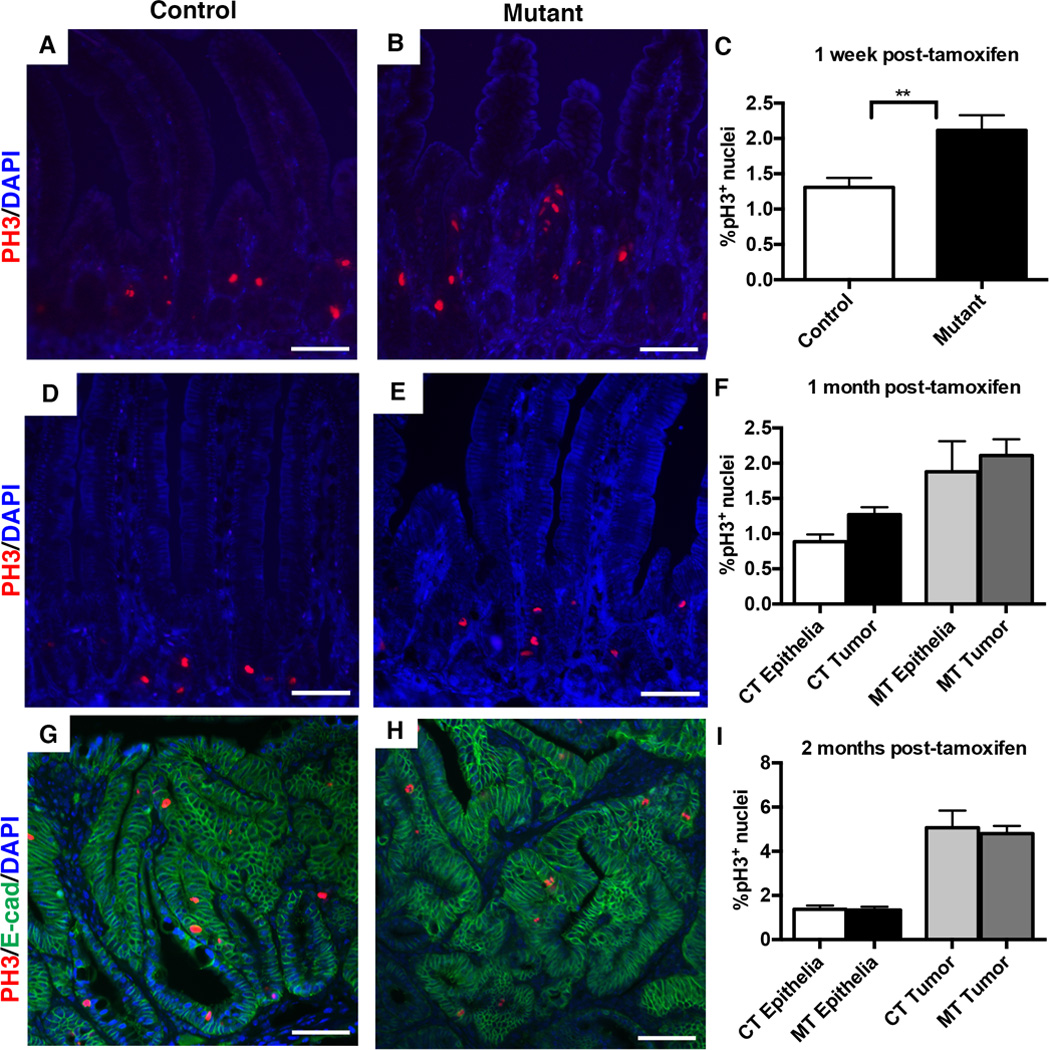
Figure 6. Loss of Dnmt1 in the ApcMin/+ intestine causes an acute increase in crypt cell proliferation.

Percentage of cells in mitosis was determined by immunostaining and counting of phospho-H3 positive (pH3+) nuclei in the small intestine one week, one month, and two months following tamoxifen treatment. The percentage of pH3+ cells was calculated as the number of pH3+ nuclei, divided by the total number of epithelial nuclei.
(A–C) One week following tamoxifen injection, mutants displayed a significantly increased percentage of pH3+ cells (C, n=4 per genotype). Representative images of pH3 immunostaining are shown for controls (A) and Dnmt1 mutants (B).
(D–F) One month after tamoxifen treatment, mutants (E) and controls (D) displayed comparable percentages of pH3+ cells, in both tumors and non-cancerous epithelia (F). 24 tumors across 5 mice were counted for Dnmt1-mutants; 4 tumors across 4 mice were counted for controls. ~1,500 non-cancerous cells were counted from the same biological replicates to calculate pH3 frequency in non-tumor tissue.
(G–I) Two months after tamoxifen treatment, mutants (H) and controls (G) displayed comparable percentages of pH3+ cells, in both tumors and non-cancerous epithelia (I). 24 tumors across 7 mice were counted for Dnmt1-mutants; 8 tumors across 3 mice were counted for controls. Non-tumor epithelia quantified as in (D–F). E-cadherin (green) outlines the intestinal epithelium.
All scale bars are 50µm. For all graphs, data are presented as average±SEM; **P<0.01 by Students’s t-test (C). One-way ANOVA was performed for (F, I), and the results were not significant.
