
Figure 1.
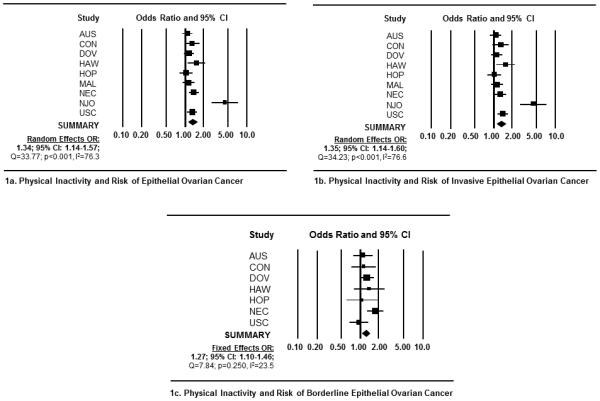
Forest plots depicting study-specific and summary ORs and 95% CIs representing the association between recreational physical inactivity and risk of epithelial ovarian cancer (EOC). Forest plots include measures of association for (1a) all EOC histological types combined; (1b) all invasive tumors combined; and (1c) all borderline tumors combined. Study specific ORs and 95% CI were estimated utilizing logistic regression models adjusted for age, race, parity, oral contraceptive use, history of breast or ovarian cancer in first-degree relative, and a personal history of endometriosis. Summary ORs were generated via random-effects models if significant heterogeneity was detected (i.e., Q-statistic p-value <0.05 or I-squared >50%). Each square represents study-specific ORs and the lines represent the width of the 95% CIs. The size of the square is proportionate with the size of each study. The weighted, summary OR and 95% confidence interval is represented by the black diamond in each figure.