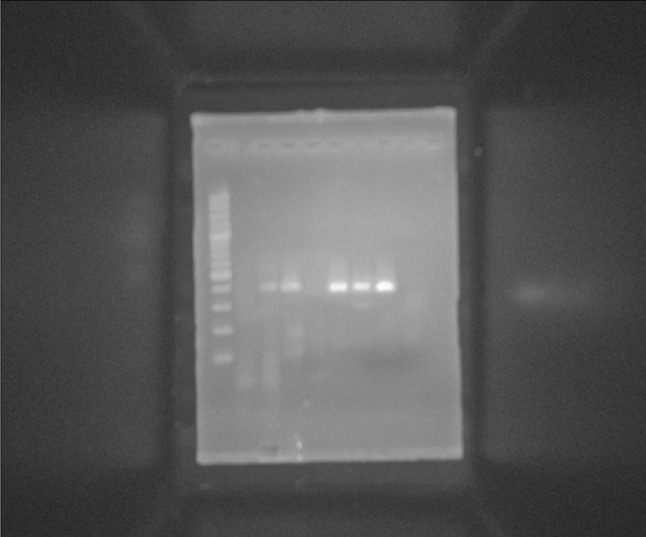
Fig. 6.

RT-PCR analyses of the temporal expression pattern of hepatocyte-specific marker (CK-18) after hepatic differentiation of MSCs. M PCR marker (100–1000 bp), Lane 1 non induced day 4 (negative control), Lane 2 CK-18 gene detected in day 4 induced by HGF, Lane 3 CK-18 gene detected in day 8 induced by HGF, Lane 4 CK-18 gene was not detected in day 16 induced by HGF, Lane 5 CK-18 gene detected in day 4 induced by b-FGF, Lane 6 CK-18 gene detected in day 8 induced by b-FGF, Lane 7 CK-18 gene detected in day 16 induced by b-FGF
