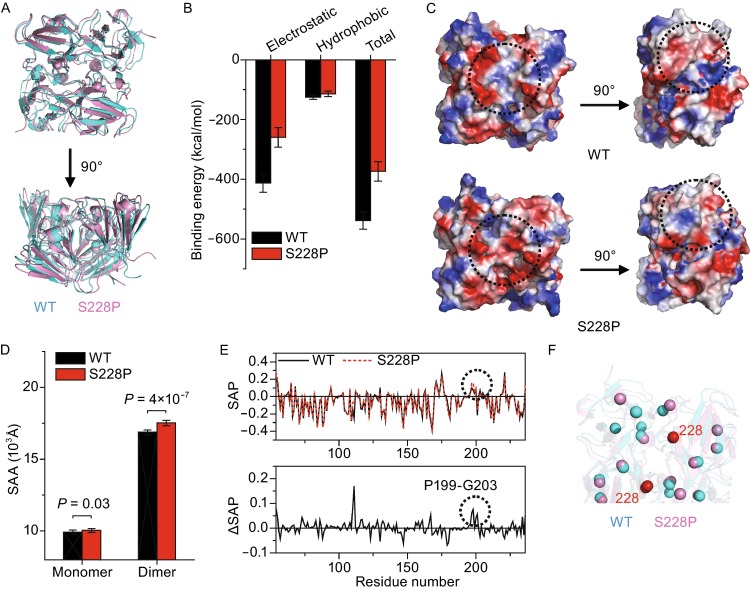
Figure 5.

The S228P mutation weakened subunit binding interface and modified surface charge distributions. (A) A comparison of the simulated dimeric structures of the WT βB1 and S228P. (B) Average subunit binding energies calculated from the simulated structures. The time-course changes in subunit binding energies are shown in Fig. S7. (C) Surface electrostatic potentials of the dimeric βB1 and S228P. The S228P mutation altered the distribution of charged residues and the representative areas are indicated by dotted circles. (D) Solvent accessible areas (SAA) of the simulated monomeric and dimeric structures. (E) Spatial aggregatory potential (SAP) of the WT and mutated proteins. The extra exposed residues in the mutant were selected by an increase of SAP for residues with positive SAP values. The dotted circle indicates the region with the largest change in SAP. (F) Positions of Trp fluorophores in the simulated dimeric structures of βB1 and S228P. The Cα atoms of Trp residues are shown in spheres. The positions of residue 228 are also shown in red
