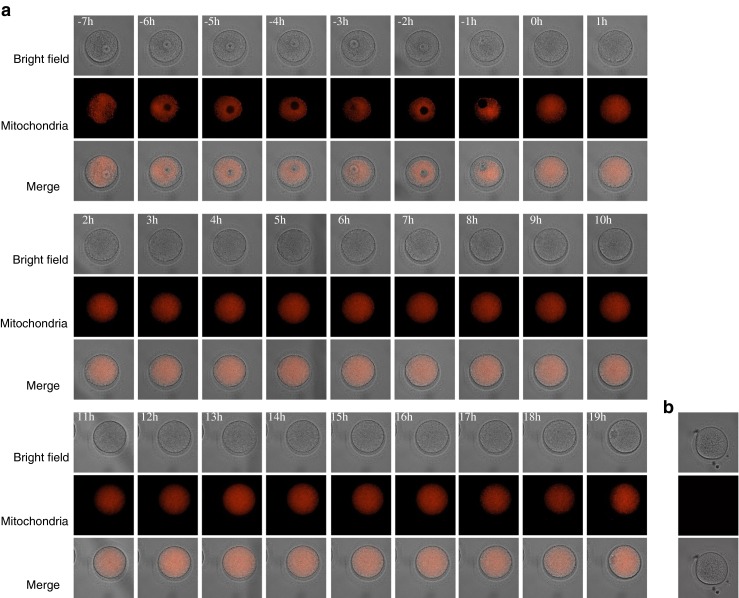
Fig. 1.

Live cell imaging of mitochondrial dynamics during meiotic maturation of human oocytes. Images of first, second and third rows show bright field, mitochondria and merged images. Numbers on the upper left corner in each panel show elapsed times (in hour) before or after GVBD (a). Non-labelled oocytes (b)
