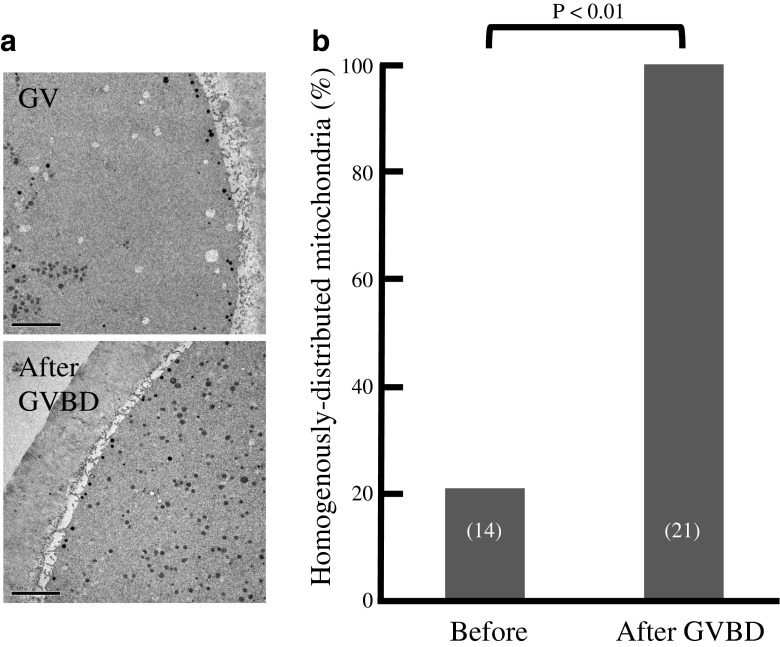
Fig. 3.
Mitochondrial distribution during meiotic maturation of human oocytes. a TEM images of oocytes during meiotic maturation. No significant mitochondria were found in the juxtamembrane area of GV stage oocytes (upper image). Most mitochondria displayed a cluster-like distribution. Mitochondria were distributed homogenously in the cytoplasm after GVBD (lower image). b Proportions of oocytes with homogenously distributed mitochondria before and after GVBD were analysed morphometrically using TEM images. The numbers of examined oocytes are shown in parenthesis. Data were compared by student’s t test. Original magnification ×5,000. Scale bar = 5 μm. Characteristics of oocytes used in this study were shown in Table 2. Donor age was shown mean ± SD

