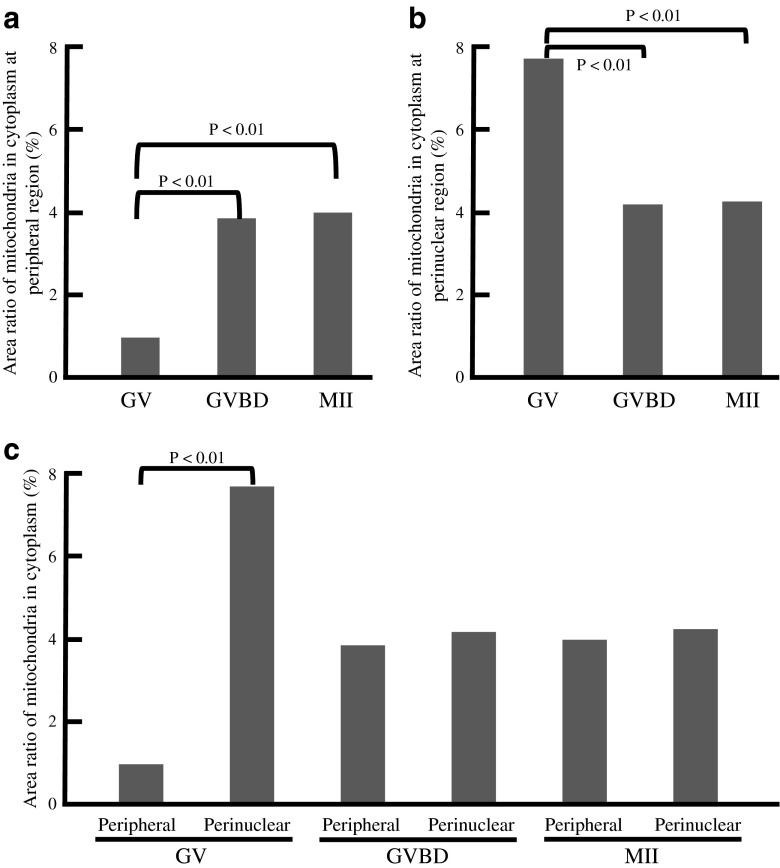
Fig. 4.
The area ratio of mitochondria in cytoplasm at perinuclear and peripheral regions obtained from TEM (×15,000) images. The area ratio of mitochondria in cytoplasm at peripheral region (a) and perinuclear region (b) of GV, GVBD and mature (MII) oocytes. c The area ratio of mitochondria in cytoplasm at perinuclear and peripheral regions of GV, GVBD and MII oocytes. Data were compared by Fisher’s PLSD test following ANOVA (a and b) and by student’s t test (c). Characteristics of oocytes used in this study were shown in Table 2

