
Figure 1.
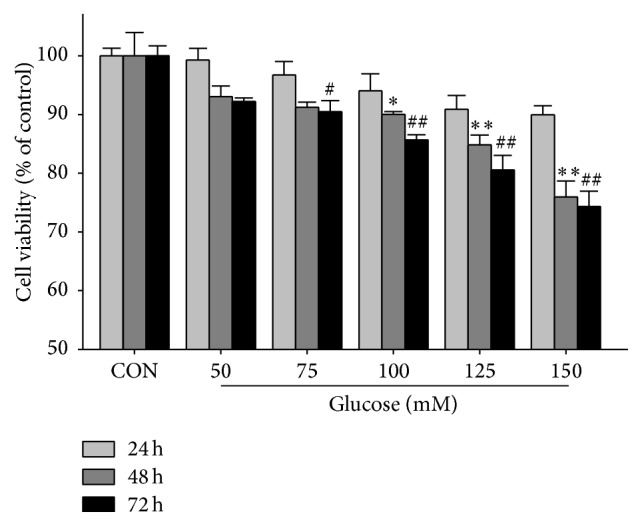
Effects of glucose concentration and culture time on PC12 cell viability. Data are presented as mean ± SEM (n = 3). The difference between the control (CON) group and the treatment group with different concentrations of glucose after 24, 48, and 72 h. Significant level: ∗ p < 0.05, ∗∗ p < 0.01, # p < 0.05, ## p < 0.01.