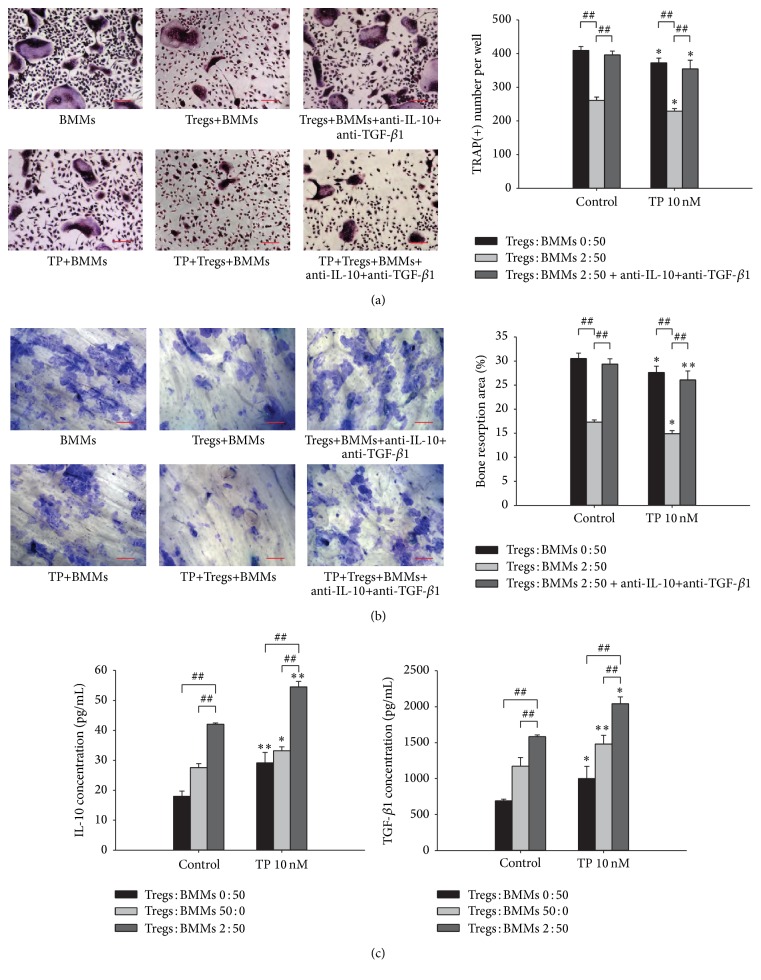
Figure 3.
The effect of the indicated concentrations of triptolide on cocultures of Tregs and BMMs. (a) The cells were stained with TRAP, and TRAP-positive cells containing 3 or more nuclei were scored. Scale bars = 100 μm. (b) The area of the bone resorption pits of the osteoclasts was visualized by staining with toluidine blue and measured using an image analysis program. Scale bars = 100 μm. (c) The levels of IL-10 and TGF-β1 in the coculture supernatants were measured by ELISA. ∗ P < 0.05 and ∗∗ P < 0.01 compared with the control group (TP 0 nM group). # P < 0.05 and ## P < 0.01 compared with the coculture system.

