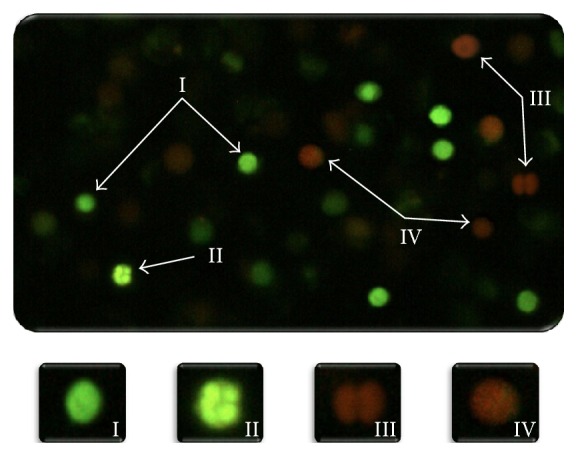
Figure 2.

Morphology of viable cells (early apoptotic and nonapoptotic cells) and nonviable cells (late apoptotic and necrotic cells) assessed with AO/EB staining (40x). Viable cells stain uniformly showing green (I). Early apoptotic cells with intact plasma membranes appear green, with “dots” of condensed chromatin that are highly visible within (II). Late apoptotic cells are stained showing bright green-orange because membrane blebbing starts to occur. EB can enter the cells (III). Necrotic cells are stained emitting bright orange due to the entry of EB into these cells (IV).
