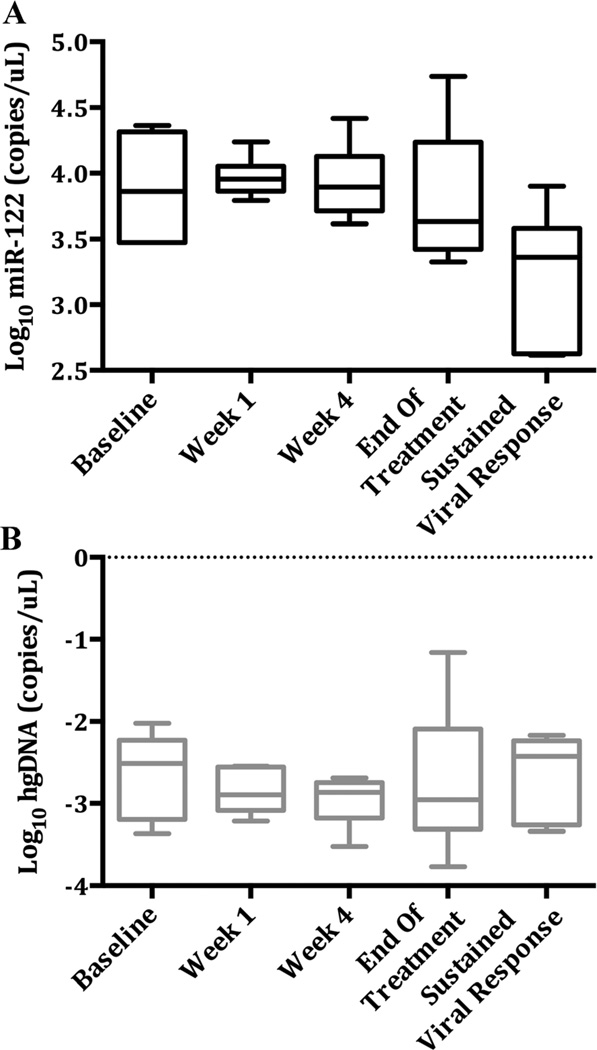
Fig. 4.
Serial miR-122 and hgDNA values across treatment time points for patients undergoing hepatitis C treatment. A: Log miR-122 levels across treatment time points. Median values decrease following Week 1, and are significantly lower at sustained viral response. B: Serial Log10 hgDNA levels across treatment time points. No significant differences were observed in hgDNA levels. Plots presented using Tukey method.

