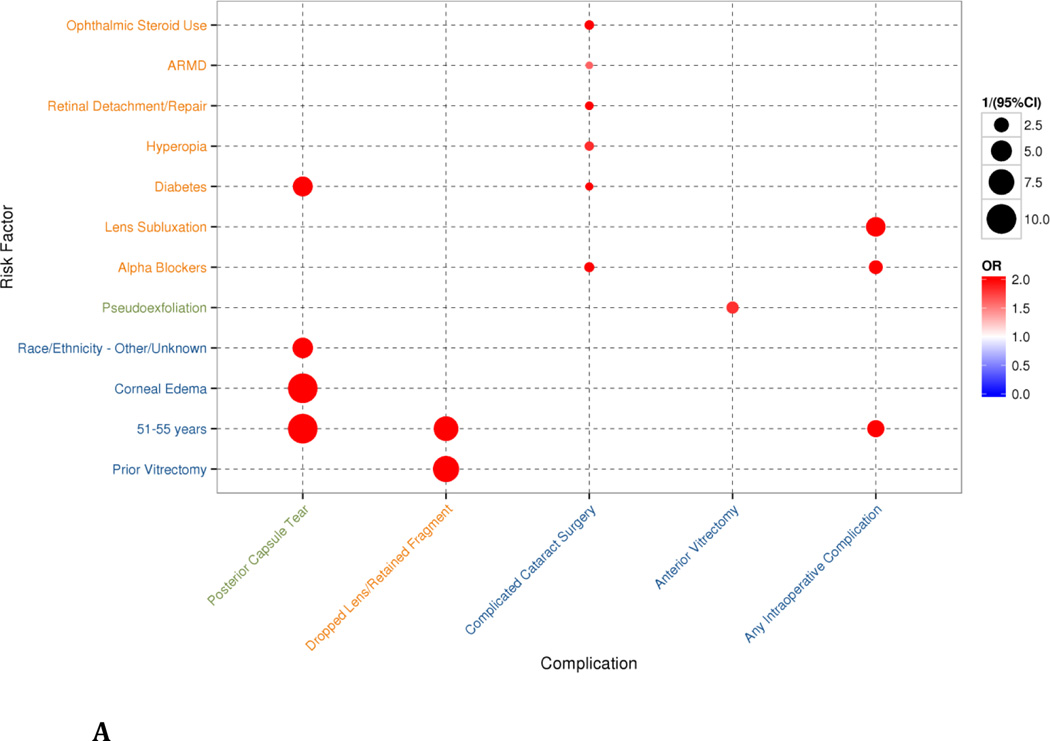
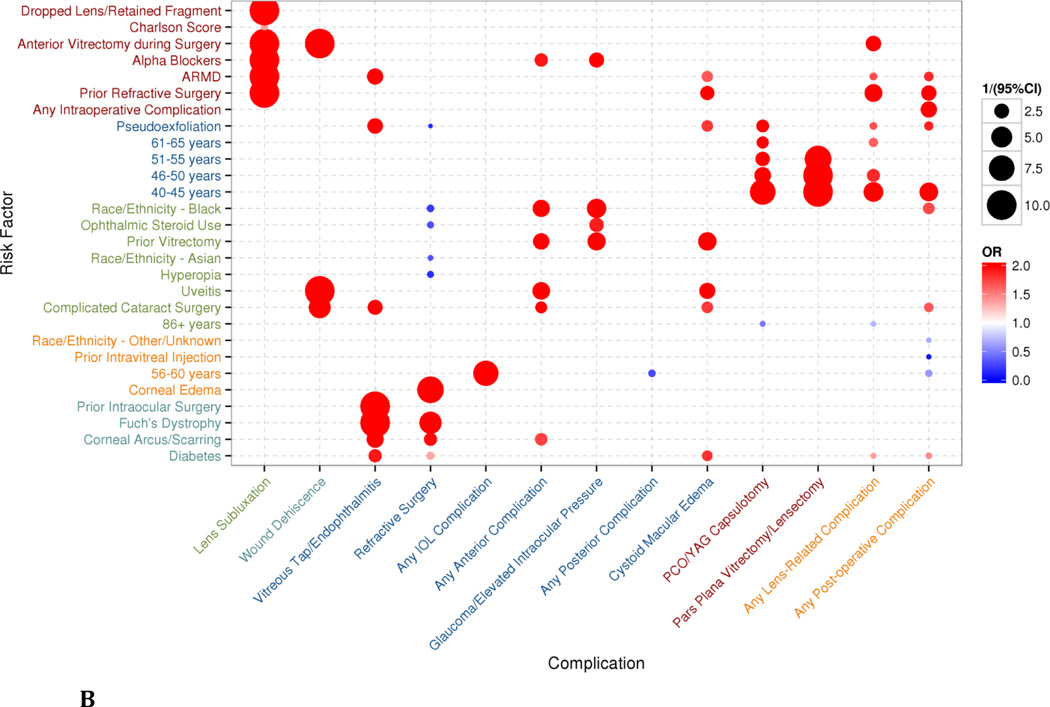
Figure 2.
Bubbles represent statistically-significant (p<0.05) results of multivariate regression of variables identified by a bootstrapped least absolute shrinkage and selection operator (LASSO) model. The size of the bubble corresponds to the inverse of the 95% confidence interval (CI)—that is, 1/(95%CI)—such that results with a larger variance are shown as smaller bubbles and results with a smaller variance are shown as larger bubbles. The color of the bubbles is related to the odds ratio (OR), with blue indicating an OR <1 and red indicating an OR>1 (the maximum value of the OR was capped at 2 in the graphical representation). Axes are organized through complete linkage hierarchical clustering to show similarity between groups of risk factors and complications. A) Intraoperative complications from multivariate regression on risk factors selected through bootstrapped LASSO model, clustered in 3 groups for each axis. B) Postoperative complications from multivariate regression on risk factors selected through bootstrapped LASSO model, clustered in 5 groups for each axis.


