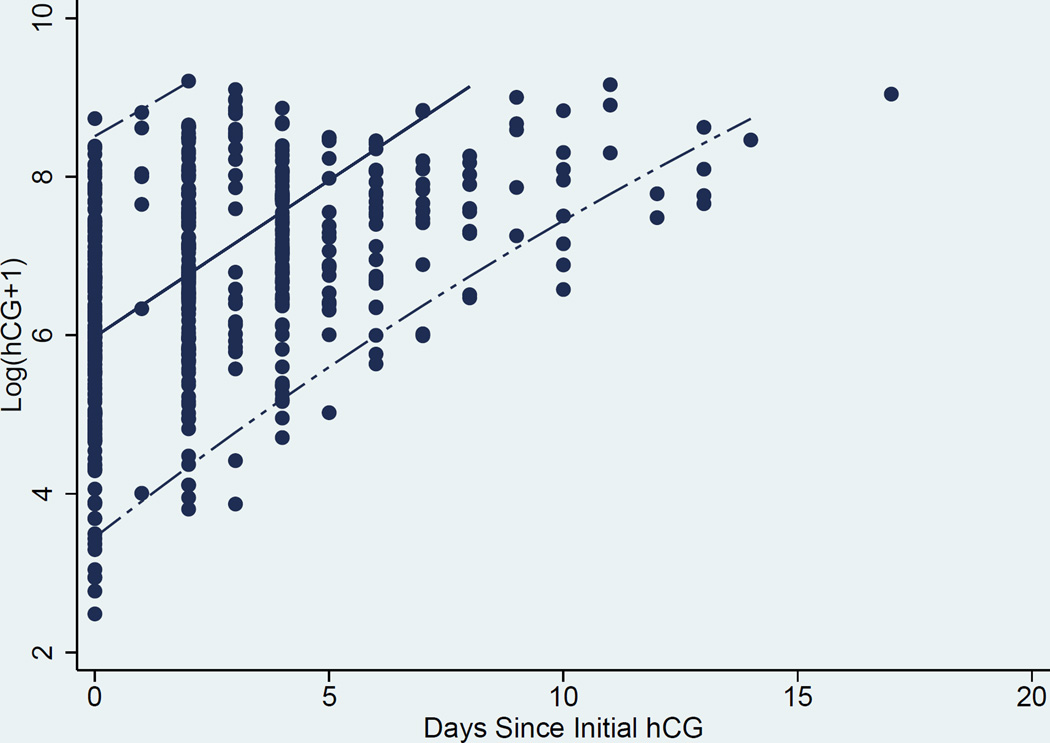
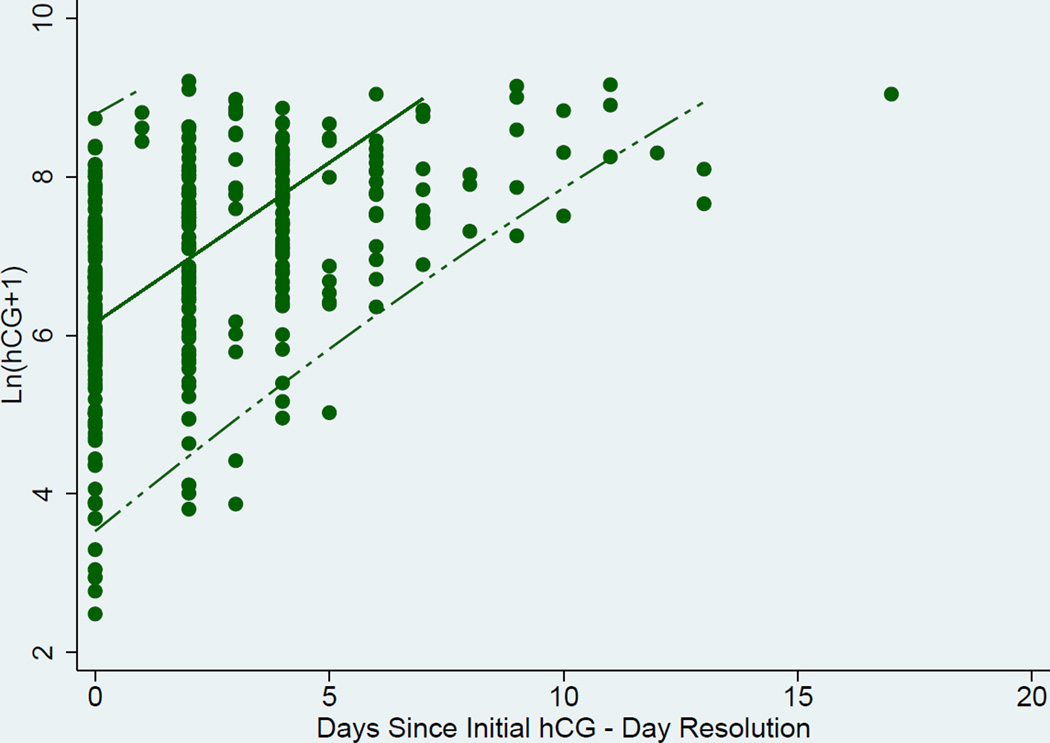
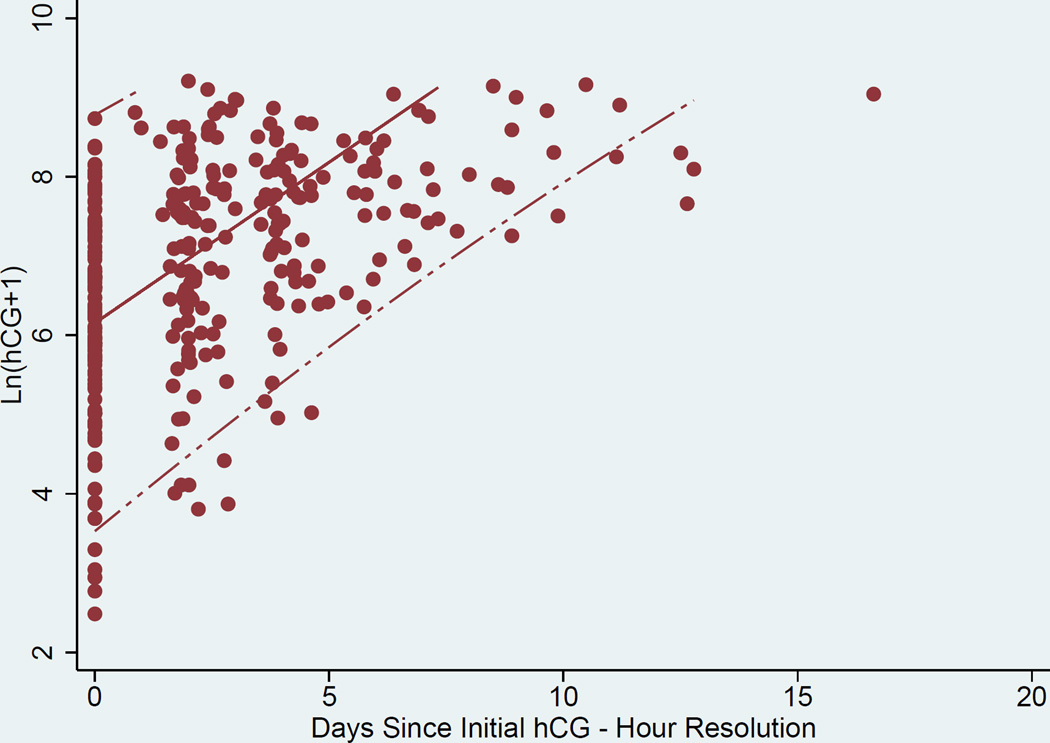
Figure 2.
a. Scatter Plot, best linear fit (solid line) and 95% confidence interval (dashed lines) of ln hCG rise derived from “raw” data from clinical database (day resolution).
b. Scatter Plot, best linear fit (solid line) and 95% confidence interval (dashed lines) of ln hCG rise derived from validated data from EMR (temporal resolution by day).
c. Scatter Plot, best linear fit (solid line) and 95% confidence interval (dashed lines) of ln hCG rise derived from validated data from EMR (temporal resolution by hour).


