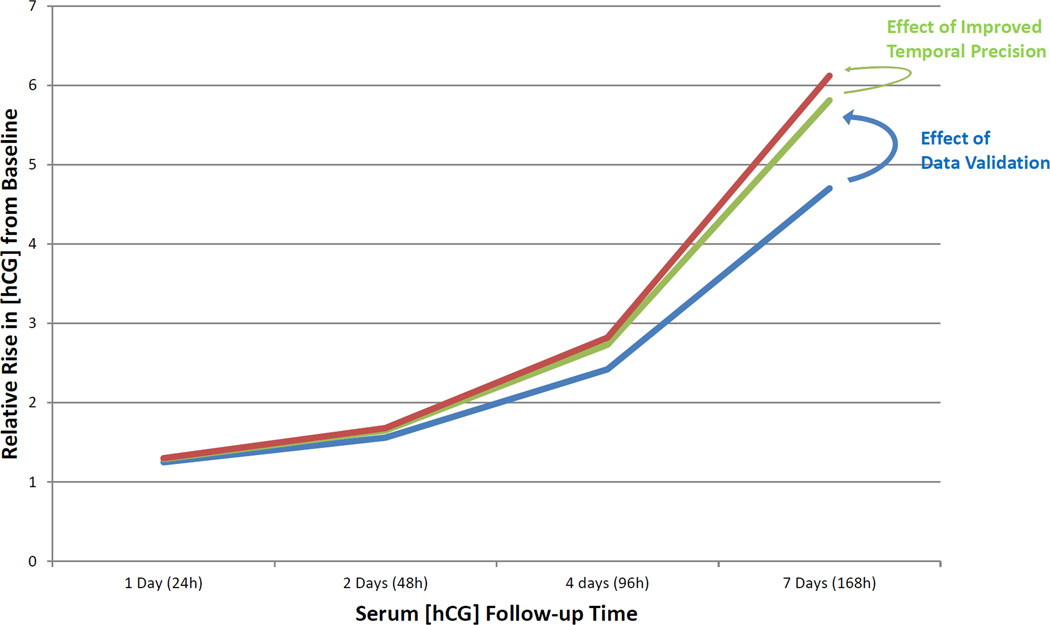
Figure 3.
Relative rise in serum hCG for the 1st percentile of patients (the slowest predicted increase for women with a normal intrauterine pregnancy). Blue line is hCG rise with raw data, green line is hCG rise with data validation and red line is hCG rise with data validation and improved temporal precision.

