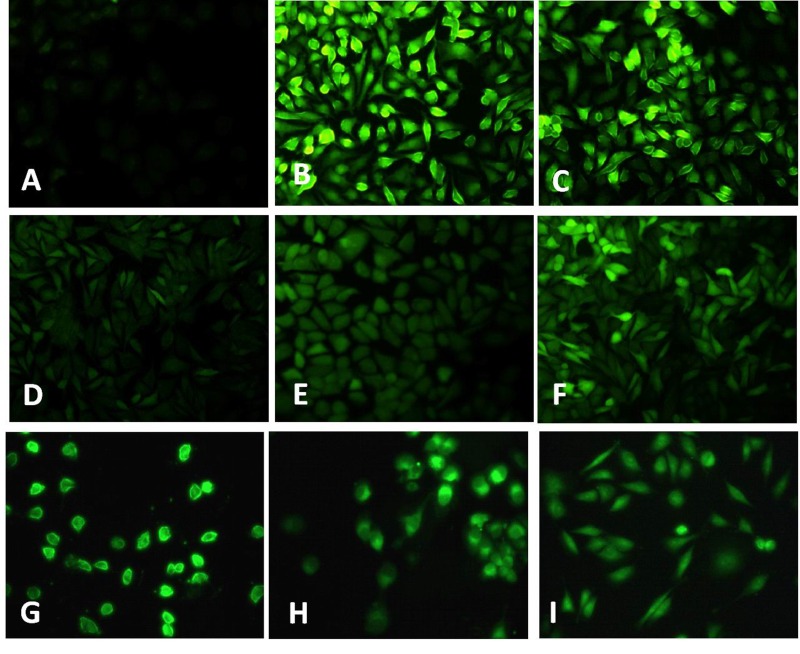
Fig. 2. TNF-α induced ROS formation in HUVECs.
Cells were treated with TNF-α (10 ng/mL) (B) and H2O2 (50 µM) (C) for 24 h, the ROS formation was determined with CM-DCFH2-DA. After 2 h pretreated with DPI (10 µM) (D), rotenone (10 µM) (E), NAC (1 mM) (F), CPT (0.25 µM) (G), CPT (0.5 µM) (H), CPT (1 µM) (I), the ROS gene ration was measured. A. Without TNF-α treatment.

