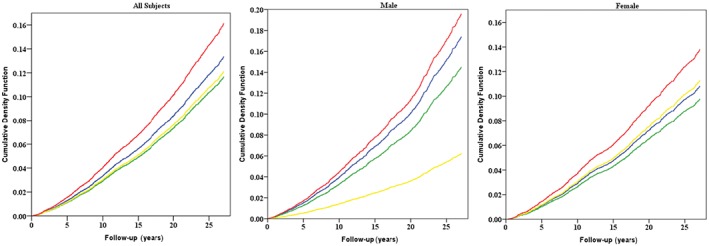
Figure 1.

Effects of baseline body mass index (BMI) on esophageal squamous cell carcinoma mortality for all subjects, male, and female, as shown by cumulative event rates (cumulative density function, as %) from Kaplan–Meier estimates. Red lines represent underweight participants (BMI < 18.5), blue lines represent healthy participants (BMI >= 18.5, <24), green lines represent overweight participants (BMI >= 24, <28), and yellow lines represent obese participants (BMI >= 28).
