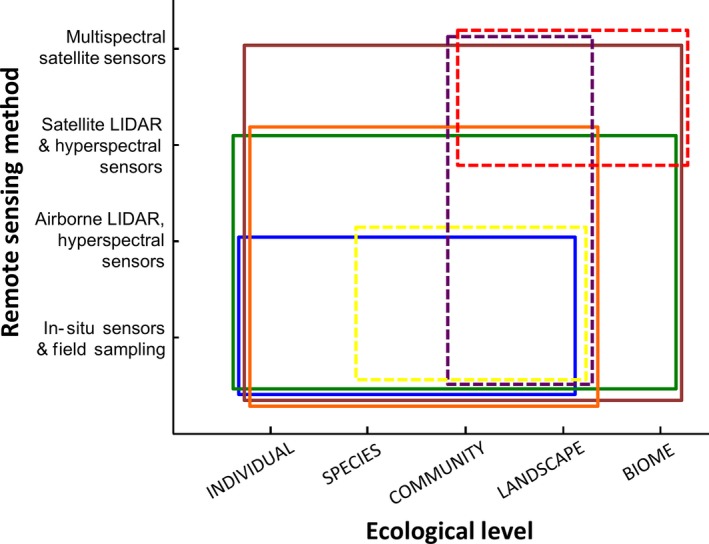
Figure 3.

Remote sensing methods for mapping plant and animal functional traits at different ecological levels. The area of the solid boxes covers the ecological levels where remote sensing methods coupled with field sampling and validation allow for the mapping of the following plant functional traits: leaf phenology (brown), leaf chemical content and mass per area (green), plant height (orange), and crown diameter (blue). Dashed boxes cover the ecological levels where remote sensing methods allow for the mapping of the following proxies that relate to animal functional trait diversity: habitat and vegetation structure (e.g., tree density and biomass; yellow), leaf area index (purple), and landscape structure (e.g., patch size, isolation, and perimeter‐to‐area ratio; red).
