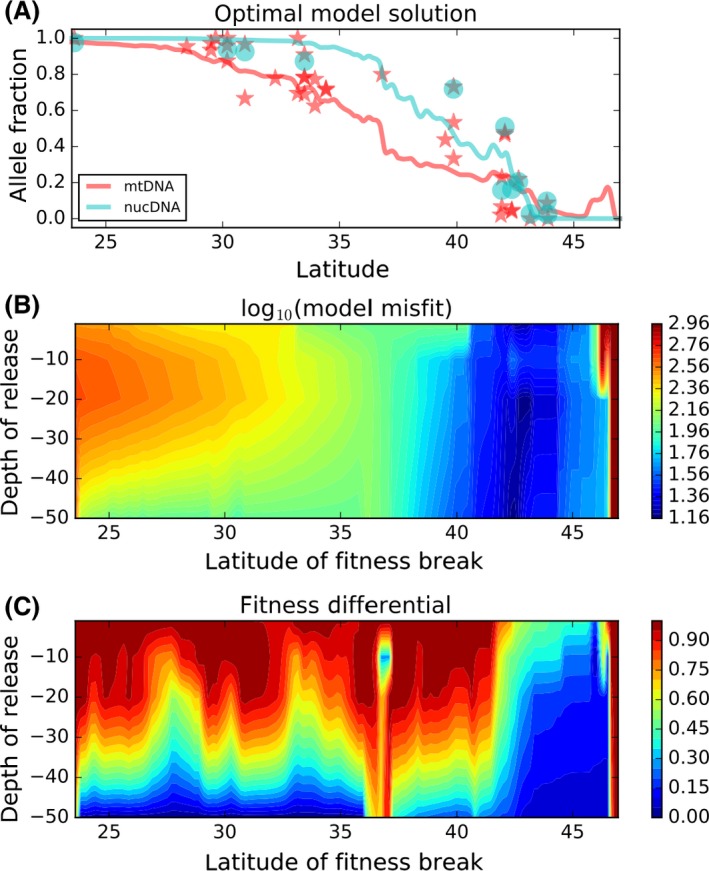
Figure 5.

A. The northern mitochondrial lineage frequency with the lowest model misfit solution for larval release at 20 m (red line) and the observed haplotype frequencies (red stars). Some locations are sampled in multiple years and each year shown as example of interannual variation. The cyan circles and line represent the same observations and inference for the nuclear genome. B. Model misfit for the optimal fitness differential, plotted by depth of release (nearly identical for mitochondrial and nuclear observations). C. Fitness differential Δ w (Hartl and Clark 2007) that leads to lowest model misfit as function of depth of release and latitude of fitness change (nearly identical for mitochondrial and nuclear observations). Fitness is defined in terms of fecundity of locally favored allele (R), with fecundity of the other allele as R*(1 − Δ w). See Appendix 1 for more details.
