
Figure 6.
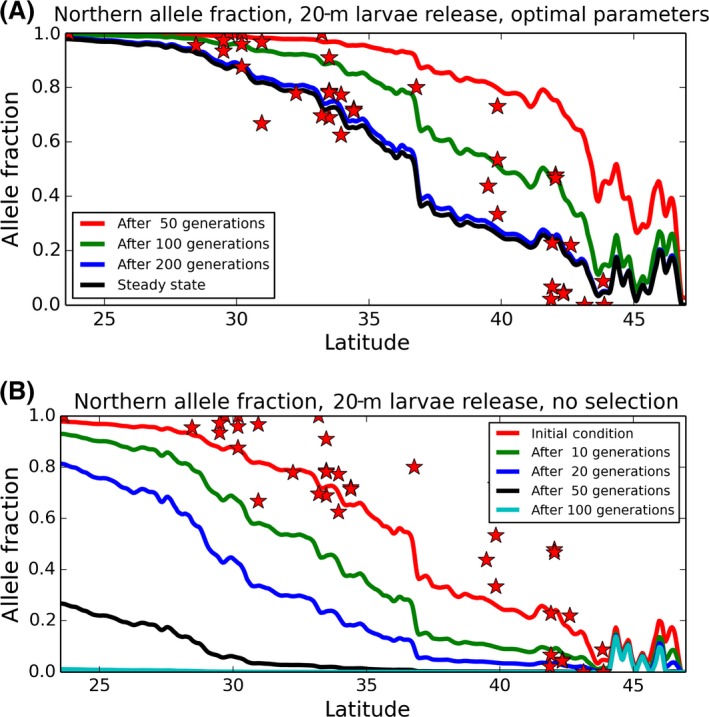
(A) The evolution of the northern‐lineage fraction from an initial condition in which the haplotype frequency is 50% at all locations. The location of the fitness break and the strength of the fitness difference are the optimal solution from Figure 5. (B) The evolution of the northern‐lineage fraction from an initial distribution based on empirical results, but with no fitness difference, through time.