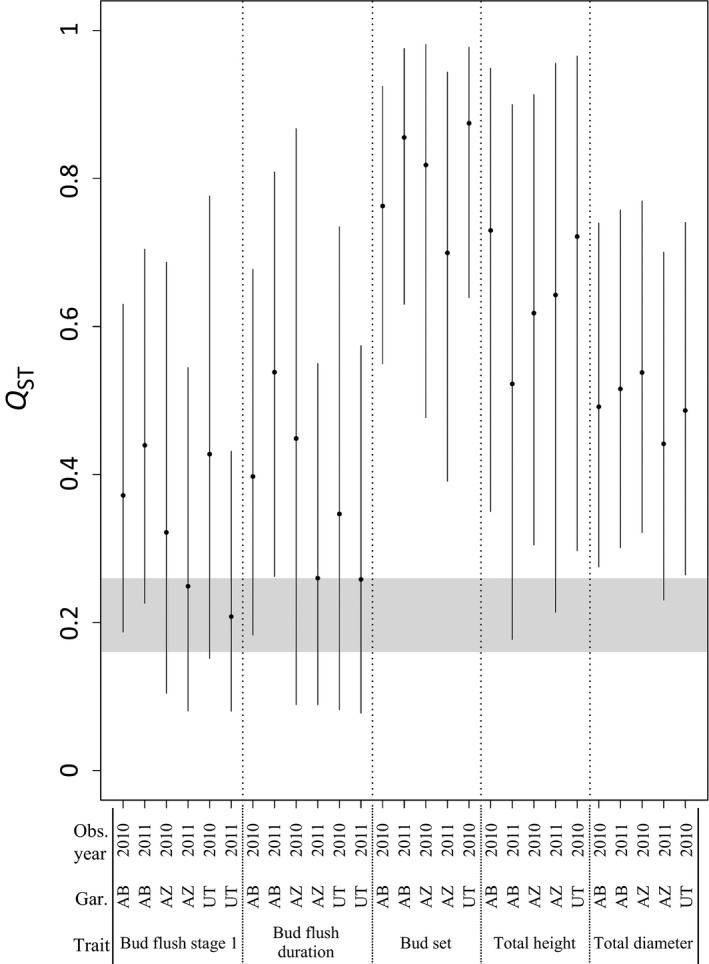
Figure 2.

Posterior mean Q ST and 95% CIs (points and vertical bars, respectively) for tree phenotypic traits measured in each of the three common gardens (AB, UT, and AZ), estimated from the nine‐population model. Gray shaded area represents the F ST 95% CI.
