
Figure 6.
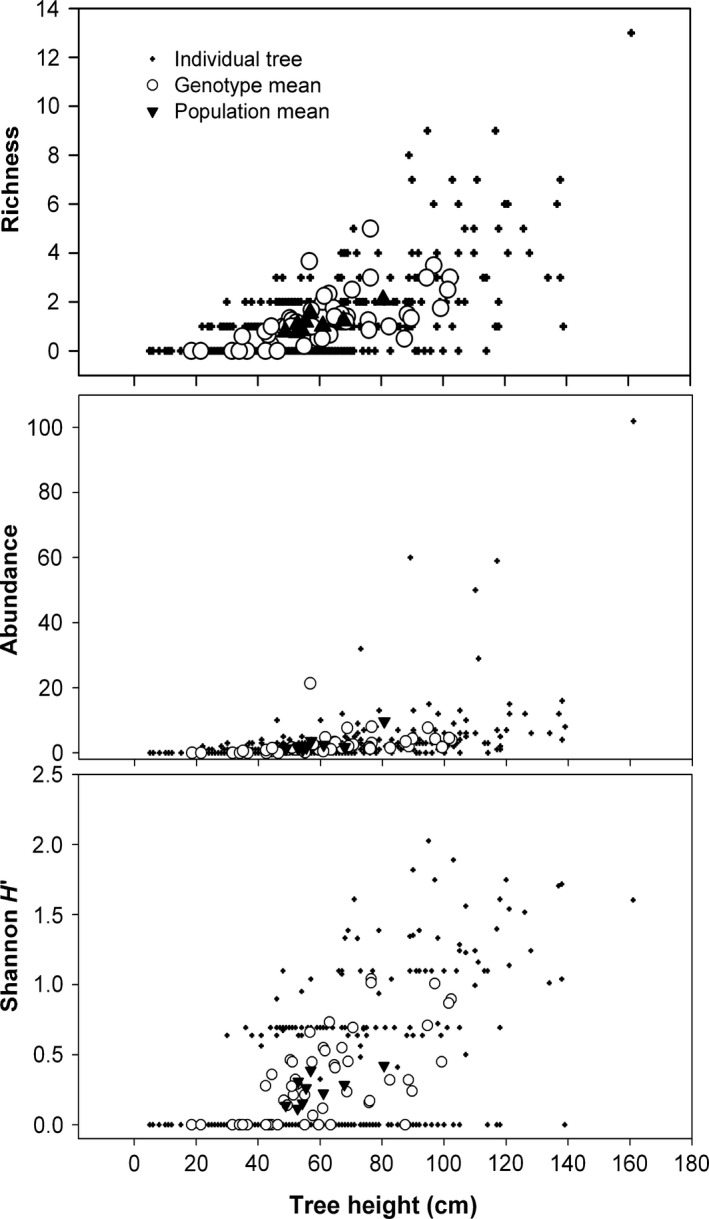
Community diversity metrics shown at the individual tree, genotype, and population levels plotted against midseason tree height in Utah in 2010.
Official websites use .gov
A
.gov website belongs to an official
government organization in the United States.
Secure .gov websites use HTTPS
A lock (
) or https:// means you've safely
connected to the .gov website. Share sensitive
information only on official, secure websites.
Community diversity metrics shown at the individual tree, genotype, and population levels plotted against midseason tree height in Utah in 2010.