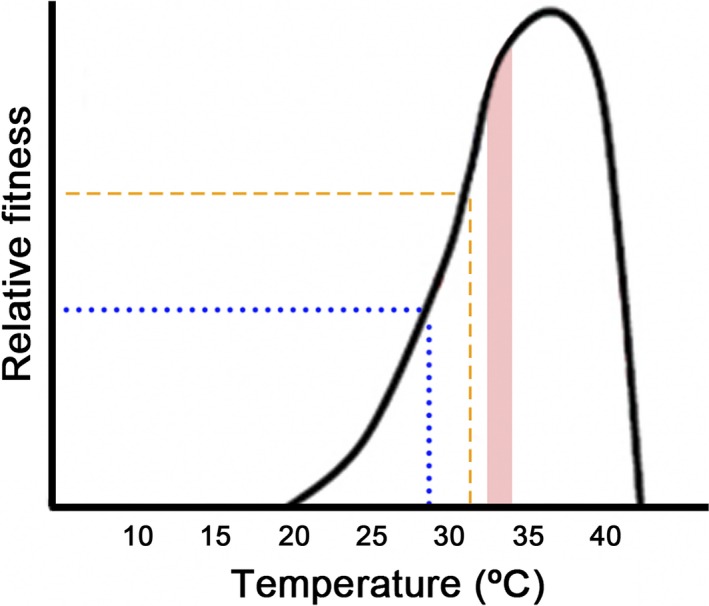
Figure 4.

Theoretical curve of thermal fitness in Iberolacerta cyreni (according to data of running performance reported by Bauwens et al. 1995). The shaded area is the preferred temperature range of I. cyreni in summer of 2012 (present study). The dotted line is the mean body temperature from 25 years ago, and the dashed line is the mean body temperature of present‐day lizards. These lines are represented with correspondingly approximate fitness as diagram of figure 1 of Huey et al. (2012), to illustrate the potential situation of I. cyreni given available data.
