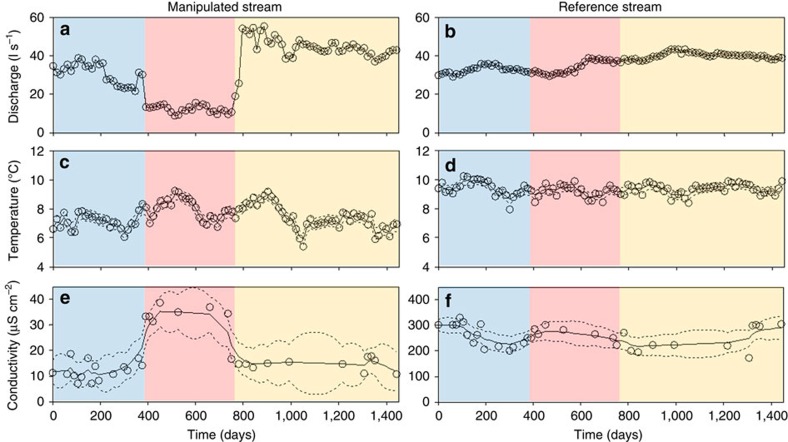
Figure 1. Environmental time series.
Time series (open dots), smoothed-state estimates (solid lines) and state 95% confidence level (dotted lines) of discharge (a,b), water temperature (c,d), and conductivity (e,f) for the downstream reach of the manipulated stream and the reference stream. Blue, red and yellow regions indicate base flow, flow alteration and flow recovery periods, respectively.

