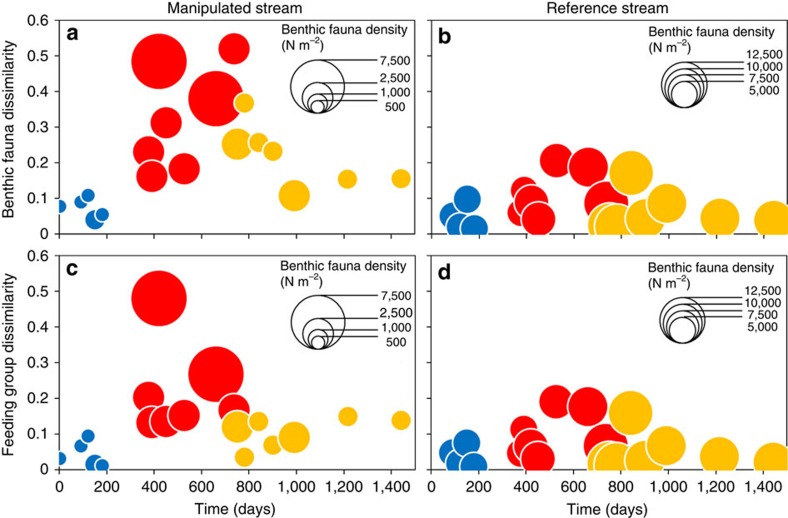
Figure 2. Temporal variability in benthic fauna and feeding group dissimilarity between reaches of the manipulated and reference stream.
Benthic fauna and feeding group dissimilarity between downstream and upstream reaches in the manipulated stream (a,c) and between subsequent sampling dates in the reference stream (b,d). The three experimental phases are shown in different colours (blue: base flow; red: flow alteration; yellow: flow recovery). Dot size refers to benthic fauna density. Note difference in dot size in the reference and manipulated streams due to much higher overall density in the reference stream.

