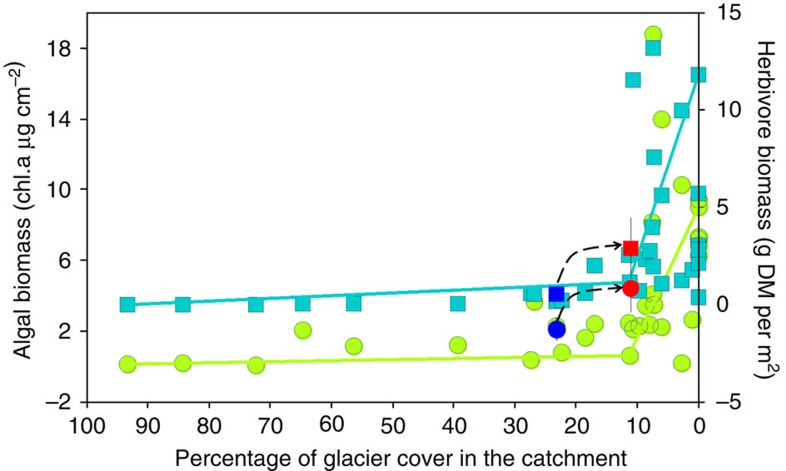
Figure 4. Spatial variability in algae and herbivores along a glacier influence gradient.
Relationship between algal (chl.a, chlorophyll a; green dots) and herbivore biomass (blue squares) as a function of the percentage of glacier cover in the catchment for 33 streams in the Antisana reserve (Ecuador). Douglas–Peucker (DP) models are fitted to algal and herbivore biomass. Data (mean 95% confidence interval) of algal (dots) and herbivore (squares) biomass obtained in our flow-reduction experiment are shown in blue (base flow) and red (low flow). The dashed line represents the shift from low to high level of algal and herbivore biomass between base flow and flow alteration stages.

