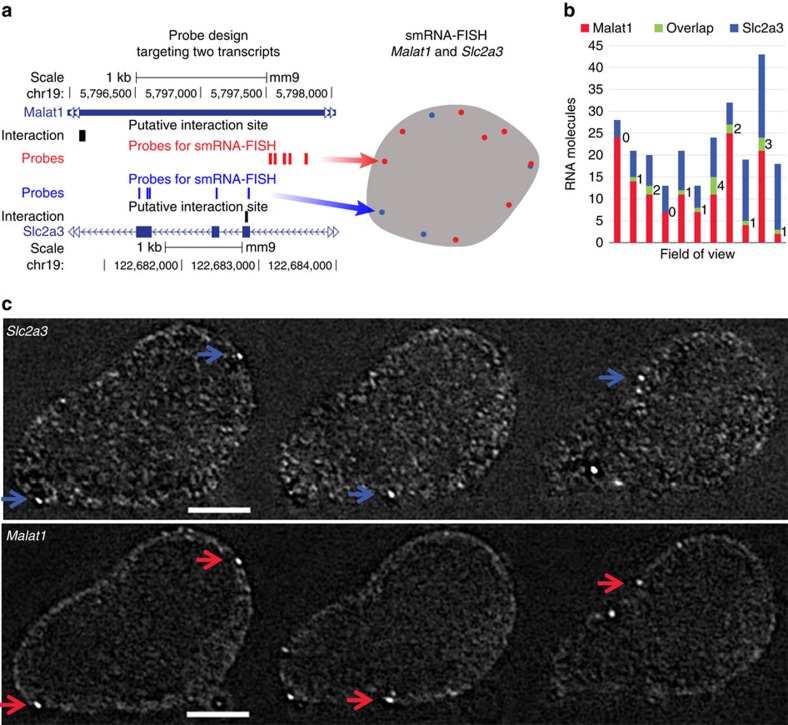
Figure 3. Testing co-localization of Malat1 lincRNA and Slc2a3 mRNA with smRNA-FISH.
(a) Positions of hybridization probes labelled with 60- (red) and 525-nm (blue) qDots. (b) Quantification of Malat1 and Slc2a3 RNA molecules. Green: number of co-localized molecules. (c) Representative images of two-colour smRNA-FISH showing four co-localized molecules (arrows). Scale bar, 10 μm.

