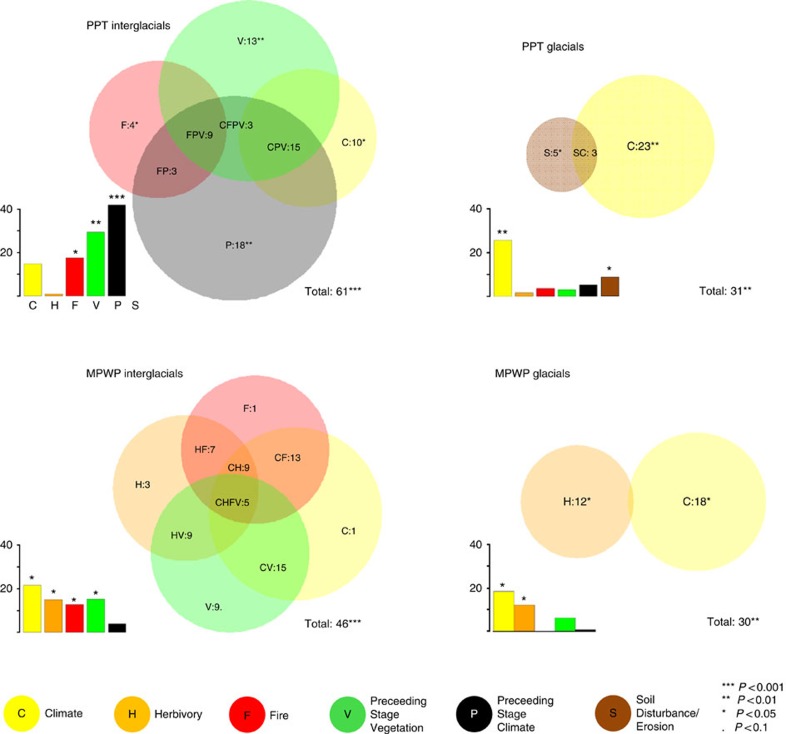
Figure 4. Drivers of vegetation change of interglacials and glacials of the MPWP and the PPT.
Bar charts indicating the variation of the pollen spectra explained by single environmental variables (climate (C), herbivory (H), fire (F), preceding-stage climate (P), preceding-stage vegetation (V) and soil disturbance erosion (S)) for each of the analysed data sets for glacials and interglacials of the PPT and of the MPWP. Venn diagrams indicate the results of variation partitioning with those variables included that separately explain a statistically significant part of the variation (P<0.1). Total variation explained (in %) is indicated in the lower left part of each sub-plot (see Supplementary Table 2 and Supplementary Fig. 6/7 for further detailed RDA results). Results imply that vegetation conditions of interglacials of the PPT are best explained by long-term drivers such as the climate and vegetation condition of the preceding glacial, instead of contemporaneous conditions such as climate or herbivory. In contrast, vegetation conditions of the PPT glacials and MPWP interglacials can be best explained by short-term drivers. Accordingly, we assume that vegetation conditions of interglacials with preceding cold glacials were in strong vegetation–climate disequilibria.

