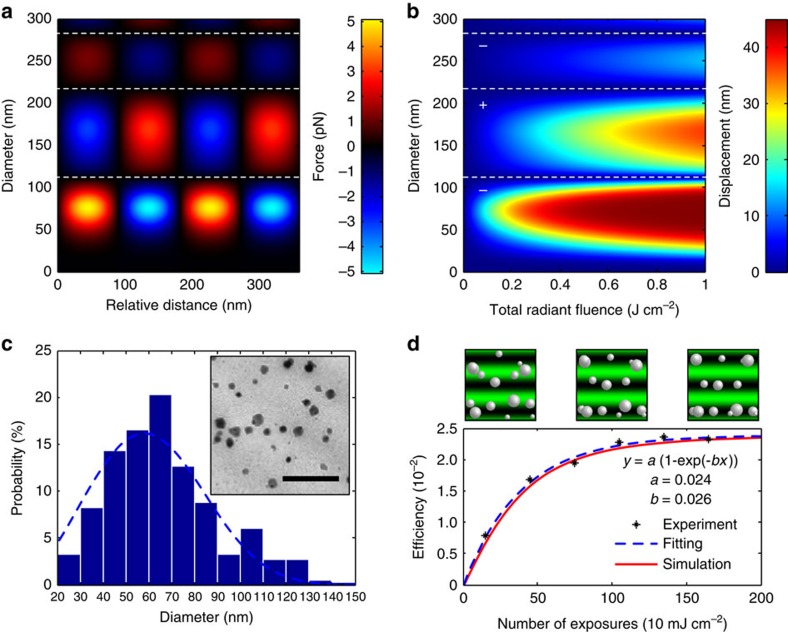
Figure 2. Dynamics of NPs observed from the optical momentum.
(a) Effect of force at the maximum gradient point produced by a laser pulse (532 nm, 10 mJ cm−2, 5 ns) on Ag NP sizes at different locations of the standing wave. (b) Magnitude of the displacement from Stokes' law after pulse exposure. (c) TEM image showing NP size distribution in the pHEMA matrix (scale bar, 500 nm). (d) Comparison between the simulated migration (red line), measured diffraction efficiency (points) and fitted curve (blue dashed line) from a multilayer structure recorded in Denisyuk reflection mode with different exposure numbers.

