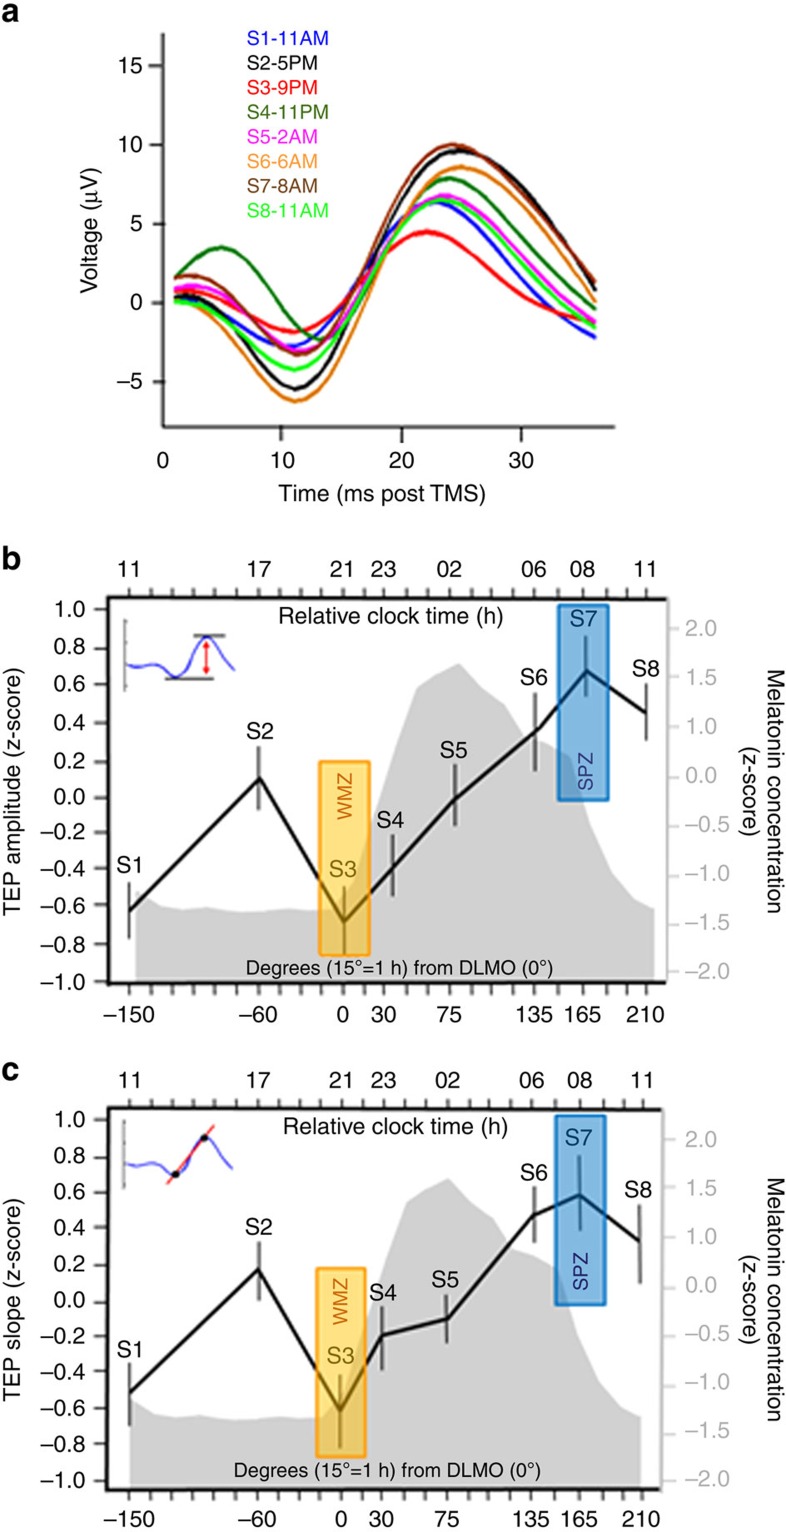
Figure 2. Non-linear changes in cortical excitability with wakefulness extension.
(a) TMS-evoked potentials (TEP; 0–30 ms post TMS) measured at the electrode closest to the hotspot, averaged in each of the eight TMS/EEG sessions, in a representative participant (habitual sleep time: 23:00–07:00). Hotspot location was provided by the neuronavigation system. Time course of TEP amplitude (b) and slope (c) with respect to the circadian cycle. Data were averaged (mean±s.d.) after standardization (z-score) and realignment to individual circadian phase (n=22; melatonin secretion onset=0°). Mean z-scored melatonin profile is displayed in grey with respect to circadian phase (bottom X axis). The top x axis indicates relative clock time for a participant with a 23:00–07:00 sleep–wake schedule. Both TEP amplitude and slope significantly changed across the 29 h of sustained wakefulness (PROC MIXED; n=22; main effect of circadian phase: amplitude F(7,128)=8.17, P<0.0001; slope: F(7,/129)=5.91, P<0.0001). Post hoc analysis revealed (1) a significant increase from the first to the last session (n=22; S1 versus S8: amplitude: Pcorr=0.0025; slope: Pcorr =0.0635], (2) a local decrease from the second afternoon session (S2) to the third evening session (S3) in the hypothetical WMZ (n=22; S2 versus S3: amplitude: Pcorr=0.037; slope: Pcorr=0.058), (3) a sharp increase during the biological night (n=22; S3 versus S7: amplitude and slope: Pcorr<0.0001], (4) ceasing after the seventh session, at the end of the theoretical SPZ (n=22; S7 versus S8: amplitude and slope: Pcorr>0.8).

