
Figure 2.
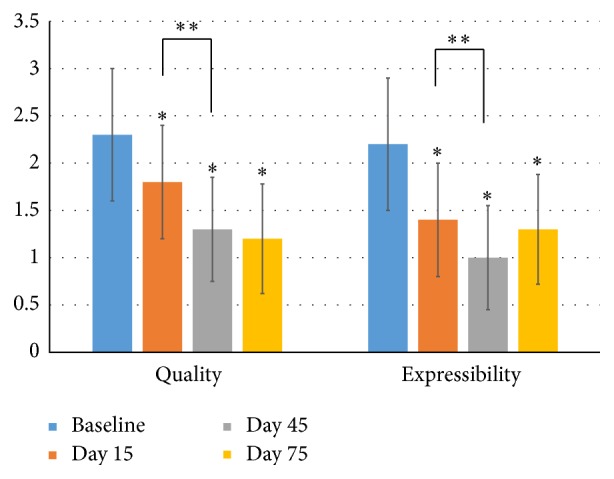
Meibomian gland secretion quality and expressibility. Notes: the y axis represents the level or grade of the meibomian gland secretion quality and expressibility, with higher grades meaning worse quality and expressibility. ∗ Compared to the baseline, the meibomian gland secretion quality and expressibility significantly improved at the visits of D15, D45, and D75 (P < 0.05). ∗∗ Between the visits of D15 and D45, the meibomian gland secretion quality and expressibility continuously improved (P < 0.05). Between the visits of D45 and D75, no significant difference was observed for the secretion quality (P = 0.68) and expressibility (P = 0.29). Statistical analysis was performed with paired t-test with the Bonferroni correction.