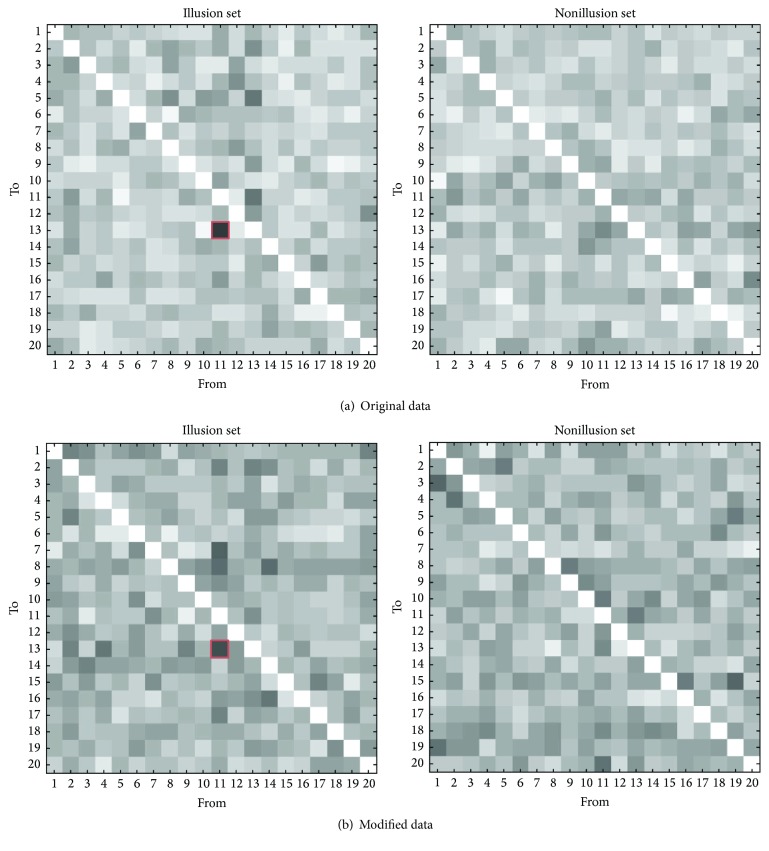
Figure 5.
Average functional connectivity matrix. Each square represents the rate of connectivity based on oxy-Hb. The thicker color of square, the more connectivity was found. (a) The matrices got by analyzing original data. The rate of connectivity from ch. 11 (right frontal cortex) to ch. 13 (right motor related areas) in illusion set (left matrix, red square) was 73.3%, which was the most among all connectivity and significantly more than that in nonillusion set. (b) The matrices got by modified data. The rate of connectivity from ch. 11 to ch. 13 in illusion set (left matrix, red square) was 66.7%. The rate was also the most among all connectivity, although it was not significantly but slightly more than that in nonillusion set.

