
FIGURE 1.
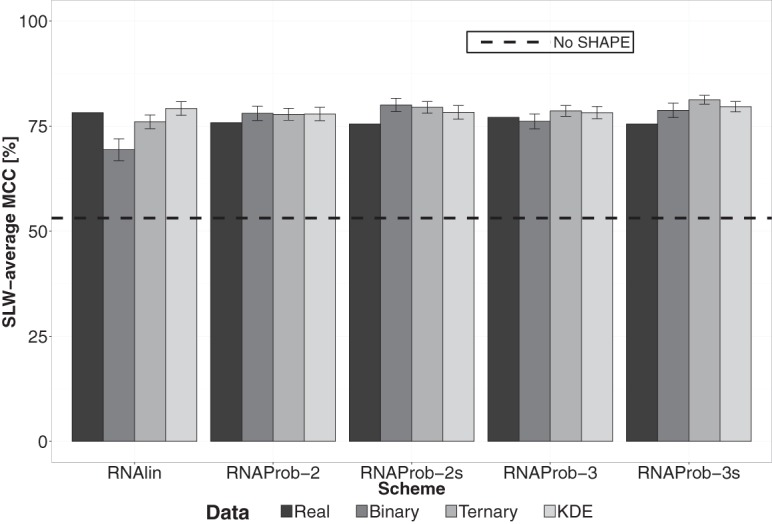
Performances on real data and simulations. “Real,” “Binary,” “Ternary,” and “KDE” represent SLW-average MCC for real data, simulated data generated using binary, ternary, and Gaussian kernel estimate models, respectively. Error bars represent standard deviations and the dashed line indicates SLW-average MCC for the no-SHAPE control.