
FIGURE 2.
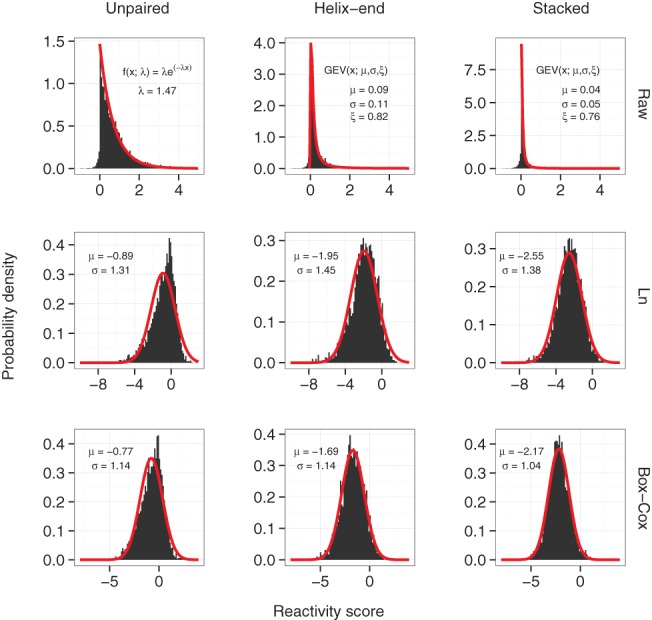
Reactivity distributions for unpaired, helix-end, and stacked bases. (Top) Untransformed, (middle) log-transformed, and (bottom) Box-Cox transformed data. Red lines correspond to fitted models. GEV represents the probability density function of the generalized extreme value distribution. Normal distributions N (μ, σ) were fitted for both logarithm (Ln) and Box-Cox transformed data. The parameters for the exponential decay and GEV distributions were derived from Sükösd et al. (2013).