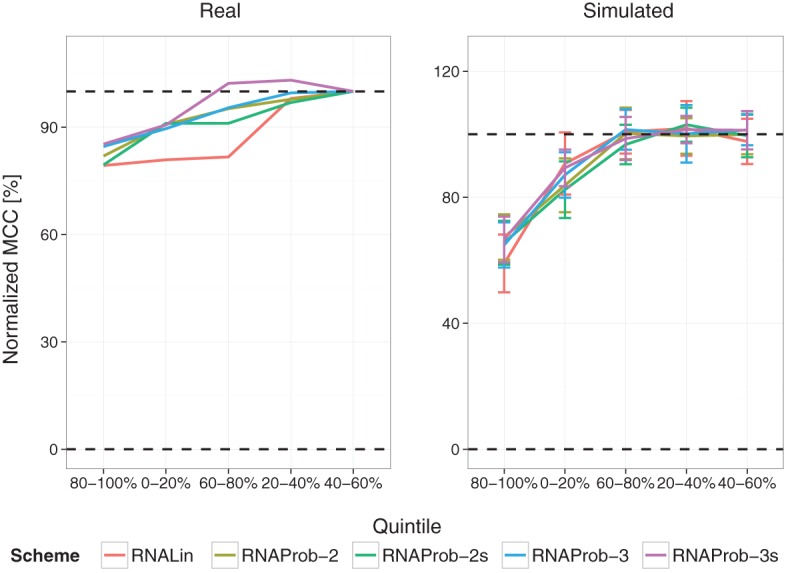
FIGURE 4.

Performances with incremental reconstruction of SHAPE profiles. Left and right panels show normalized MCCs for real data and simulations (N = 10), respectively. The bottom and upper continuous lines represent performances for the no-SHAPE control (0%) and the entire SHAPE profile (100%), respectively. Errors bars represent standard deviations.
