
FIGURE 3.
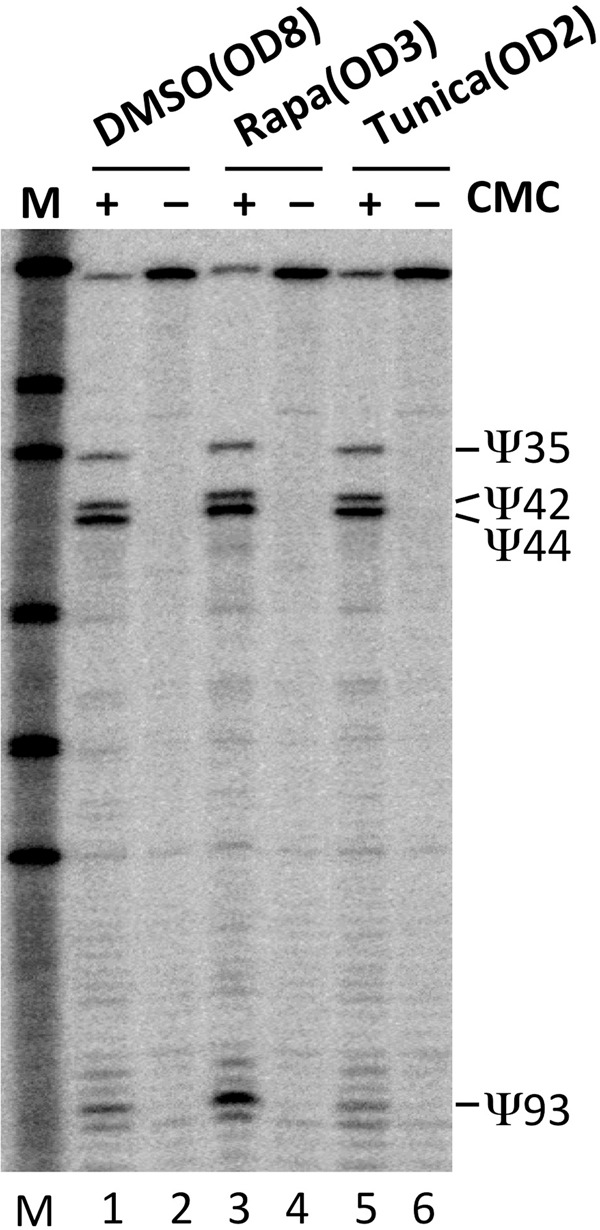
Ψ93 formation induced by rapamycin treatment. Yeast cells were treated with DMSO alone (lanes 1 and 2), rapamycin dissolved in DMSO (lanes 3 and 4), or tunicamycin dissolved in DMSO (lanes 5 and 6) for ∼12 h, and then harvested. Pseudouridylation assay was then performed. At the moment of cell harvest, DMSO-treated cells reached an OD600 of ∼10, whereas rapamycin- and tunicamycin-treated cells reached an OD600 of only ∼2–3.