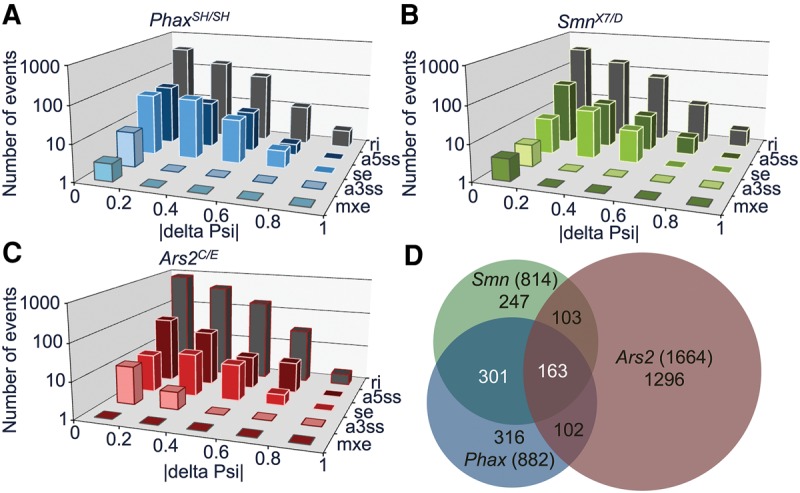
FIGURE 4.

Alternative-splicing differences among snRNP biogenesis mutants. Distribution of significant alternative-splicing changes from small |delta Psi| near zero to large |delta Psi| near one: (A) PhaxSH/SH mutants relative to WT; (B) SmnX7/D mutants relative to WT; and (C) Ars2C/E mutants relative to WT. (D) Venn diagram of overlapping alternative-splicing changes in snRNP biogenesis mutants, labeled as in Figure 2.
