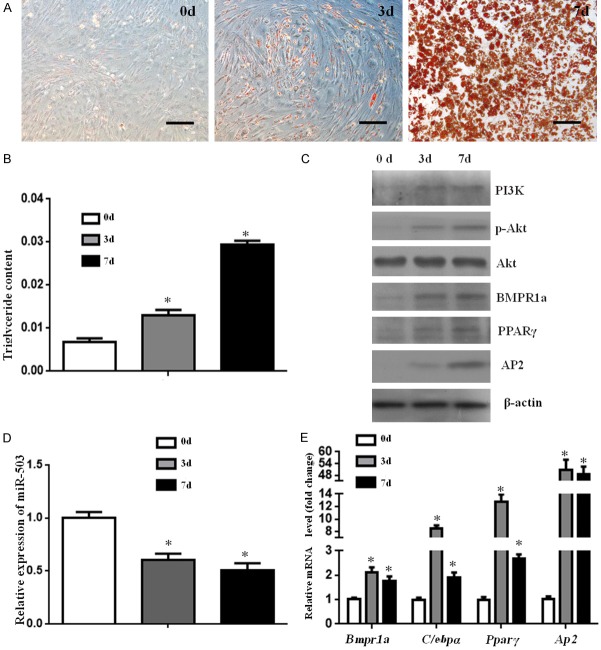
Figure 3.
Expression of miR-503 and BMPR1a during preadipocyte differentiation. A. Representative images of oil red O staining of primary preadipocytes (0 d), induced to differentiate (3 d) and mature (7 d) into adipocytes, characterized by lipid droplets. Size bars indicate 100 µm. B. The triglyceride concentration during adipogenesis process. C. Western blot analyses of BMPR1a, adipogenic-related markers (PPARγ, AP2), as well as PI3K and p-Akt during preadipocyte differentiation. D, E. qPCR analyses of genes and miR-503 expression in preadipocytes treated with adipogenic induction. Relative expression is shown for miR-503, Bmpr1a, and the adipocyte markers C/ebpα, Pparγ, and Ap2. Data represent mean ± SD. (n=3; *p<0.05 compared with day 0).

