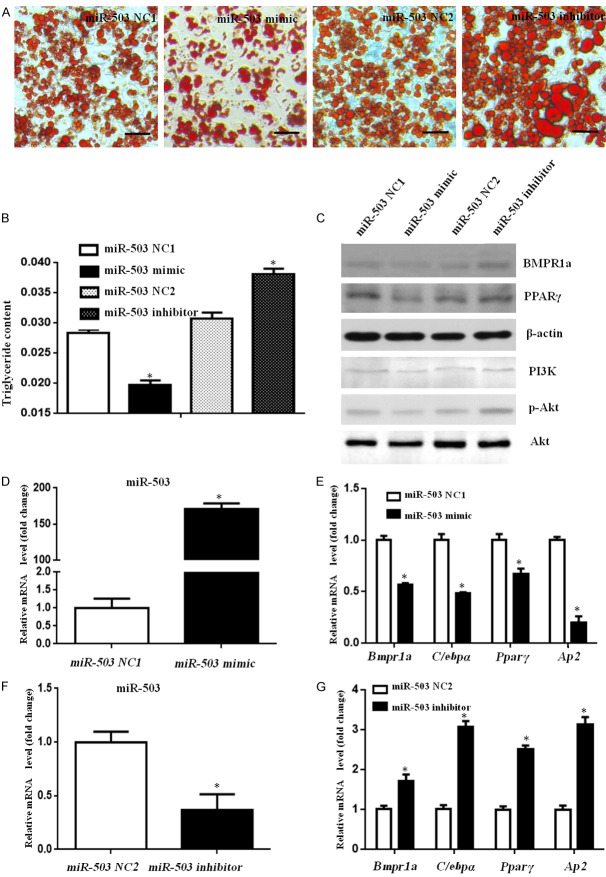
Figure 4.
MiR-503 inhibited preadipocyte differentiation by down-regulating BMPR1a expression. The miR-503 mimic/inhibitor or corresponding negative controls (NC) were transfected into preadipocytes using Lipofectamine 2000, and then cells were induced to differentiate. (A) Oil red O staining and (B) Triglyceride concentration of the four groups at day 10. Size bars indicate 50 µm. (C) Western blot of whole cell lysates of adipocytes on day 3 after induction show protein expression changes with the miR-503 mimic, inhibitor, and NCs. (D-G) The qPCR results show relative gene expression of miR-503, Bmpr1a, C/ebpα, Pparγ, and Ap2 at 72 h after transfection with a miR-503 mimic (D and E), a miR-503 inhibitor (F and G), or corresponding controls (NC). Data represent mean ± SD. (n=3; *p<0.05 compared with control).

