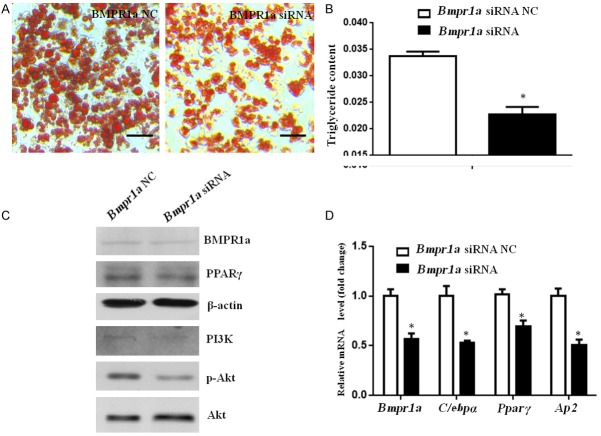
Figure 5.
Bmpr1a disruption inhibited adipogenesis. Bmpr1a-specific siRNA or negative control (NC) siRNA were transfected into preadipocytes. (A) Oil red O staining and (B) Triglyceride concentration of cells with control or silenced BMPR1a at day 10 after induction. Size bars indicate 50 µm. (C) Analyses of Western blots show protein expression in cells transfected with Bmpr1a siRNA or NC on day 3. Whole cell lysates were prepared and analyzed for BMPR1a, PPARγ, PI3K, phospho-Akt (Ser-473), and Akt expression. (D) The qPCR results show gene expression levels of Bmpr1a, C/ebpα, Pparγ, and Ap2 at 72 h after transfection with control (NC) or siRNA. Data represent mean ± SD. (n=3; *p<0.05 compared with control).

